Month: September 2024

ETH Rally Pushes Profitability To Nearly 70%

Este artículo también está disponible en español.

Ethereum’s movement last week was full of mixed signals as Spot Ethereum ETFs started to witness good inflows. Notably, ETH has been on a rally since the middle of September, reflecting a 25% gain from the September 6 low of $2,171 as it crossed $2,715 on September 27. 

Related Reading

This rally and the well-anticipated inflows in Spot Ethereum ETFs brought a much-needed breather into the Ethereum ecosystem. According to on-chain data, last week’s price action saw many Ethereum addresses moving into the profitability zone. Particularly, last week’s rally pushed Ethereum’s profitability from 59% of addresses to 69%.

Ethereum Addresses See Much-Needed Profitability

After enduring weeks of market consolidation and outflows from Spot Ethereum ETFs, Ethereum’s price began an upward trajectory in the middle of September that has reignited investor interest. According to data shared by on-chain analytics platform IntoTheBlock (ITB), the rally has led to more than two-thirds of Ethereum holders being in profit. 

The key to understanding this development lies in ITB’s “In/Out of the Money” metric, which plays a crucial role in assessing the profitability of cryptocurrency holders. This metric compares the current market price of Ethereum to the purchase prices recorded for addresses that hold the asset.

By doing so, it calculates which holders are in profit, in loss, or at the break-even point (known as “at the money”). According to this measure, Ethereum has reached its highest profitability levels in nearly two months, a significant indicator of growing bullish sentiment.

The graph below shows that the number of Ethereum addresses in profit reached 85.03 million last week, representing 69.38% of the total Ethereum addresses. At this time, Ethereum was trading at $2,693. Furthermore, the data highlights that at this time, 2.61 million ETH addresses were at the money (neither in loss nor profit), while 34.94 million ETH addresses were in losses.

ETH Profitability To Keep Rising?

Looking ahead, it is only natural to wonder if the profitability will continue to increase in October. Fortunately, the crypto industry is now reveling in bullish sentiment, especially in light of the recent Fed rate cuts and weakening currencies in some parts of the world. 

Related Reading

According to IntoTheBlock’s social media handle on X, over 80% of ETH volume is now profitable, indicating strong buying support at critical levels. With bullish projections now falling in place, we could see many more addresses and ETH easily crossing into profitability next week. 

As Ethereum pushes toward higher price levels, the focus will also turn to key psychological barriers, such as the $3,000 mark. The first step for ETH bulls is to make a clean break above $2,700 next week. This would set the stage for a successful run to $3,000, bringing even more addresses back into profit.

Featured image from Stormgain, chart from TradingView

BONK In Trouble As Sharp Decline Hints At An Impending Pullback

BONK is currently facing turbulent waters as a sharp decline casts a shadow over its recent price performance. After a period of impressive gains, the recent downturn is raising concerns about an impending correction, with mounting selling pressure suggesting that the bullish momentum may be waning. As the market sentiment shifts, the crypto community is left wondering how low BONK could go and whether it can regain its footing.

With uncertainty in the air, this analysis aims to analyze the recent sharp decline of BONK and explore the implications for its future price action. By examining key technical indicators, market sentiment, and trading patterns, we aim to assess the likelihood of an impending correction. This piece will provide insights into potential support levels and resistance points, enabling traders and investors to make informed decisions in the face of uncertainty.

Recent Performance: Analyzing The Decline

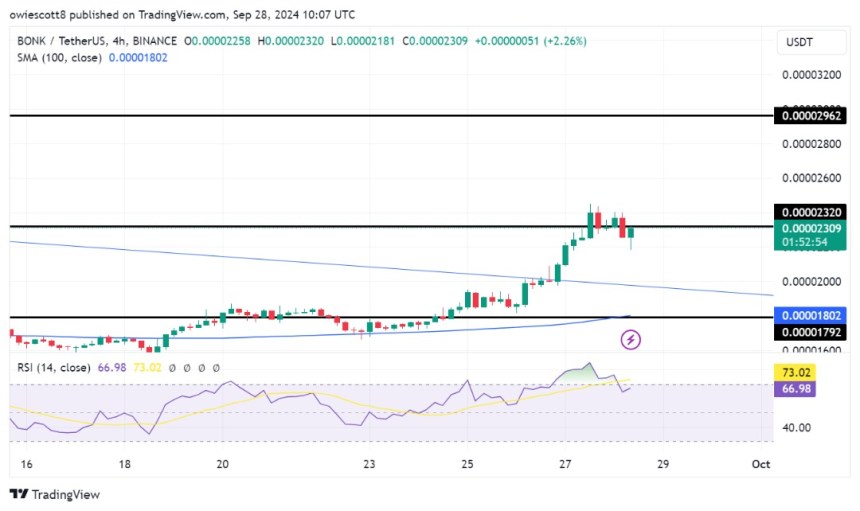
Recently, BONK’s price has turned bearish on the 4-hour chart, retracing toward the 100-day Simple Moving Average (SMA) and moving above the $0.00001792 support level. The drop from the overbought zone may signal that traders are taking profits or that buying enthusiasm is diminishing resulting in the pullback.

BONK

An analysis of the 4-hour Relative Strength Index (RSI) reveals that the signal line has decreased to 66%, retreating from the overbought territory. This decline suggests a shift in market momentum, indicating that buying pressure is beginning to wane. A retreat from the overbought zone often signals that the market may be experiencing a correction, as traders who bought during the bullish run might start to take profits.

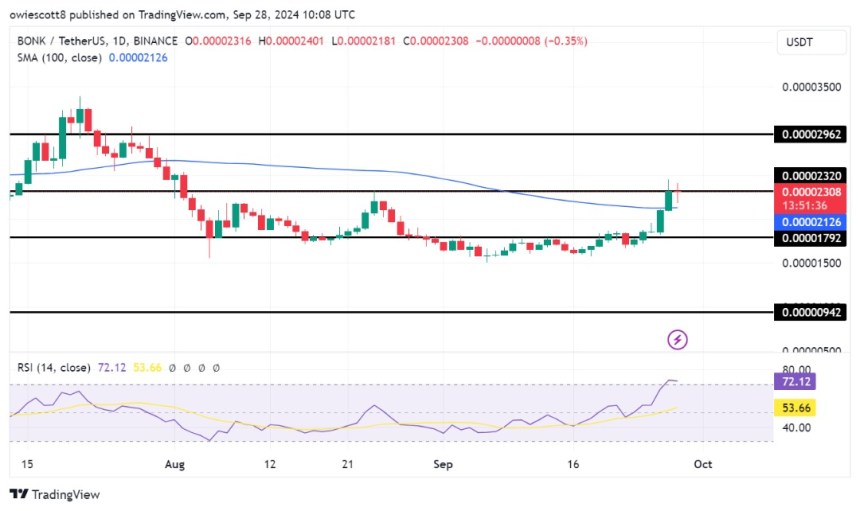
Furthermore, on the daily chart, BONK is exhibiting negative momentum, as evidenced by the formation of a bearish candlestick, even while trading above the 100-day SMA. This situation reveals a possible contradiction in market sentiment. Should selling pressure continue and BONK is unable to maintain its position above the 100-day SMA, it may lead to a more significant price correction.

BONK

Finally, on the 1-day chart, the RSI has climbed above 50% and currently sitting at 73%, reflecting strong optimistic sentiment and buying pressure. Although this points to more price gains, the closeness to the overbought zone increases the chance of a reversal if buying slows down.

Predictions For The Price Trajectory Of BONK

With technical indicators suggesting an impending pullback, BONK may face a decline in price toward the $0.00001792 level. If this support is breached, it could open the door to further losses, potentially pushing the price down to $0.00000942 and other lower ranges.

However, if the bulls manage to mount a comeback and push the price above $0.00002320, the meme coin could continue its upward momentum toward the next resistance level at $0.00002962. A successful breach of this level may trigger additional gains, allowing the price to challenge other resistance levels above.

BONK

Analyst Backs Bitcoin Hitting $290,000 In Bull Run – Here’s Why

In what has been an “unusual” September, Bitcoin (BTC) has now recorded another positive weekly performance.  According to data from CoinMarketCap, the maiden cryptocurrency surged by 5.07% in the last seven days, moving its cumulative gain in this month to 11.30%. Interestingly, with Bitcoin halving since gone, analysts remain highly expectant of the traditional market bull run by the largest digital asset.

BTC In Consolidation As It Gathers Momentum For Breakout

In an X post on Friday, popular analyst Crypto Rover predicted BTC will hit a $290,000 price mark in the upcoming bull run.

Interestingly, this price projection tallies with previous statements from analysts who put a six-figure price target for BTC following the introduction of the Bitcoin spot ETFs which represents an increased institutional demand for the crypto market leader.

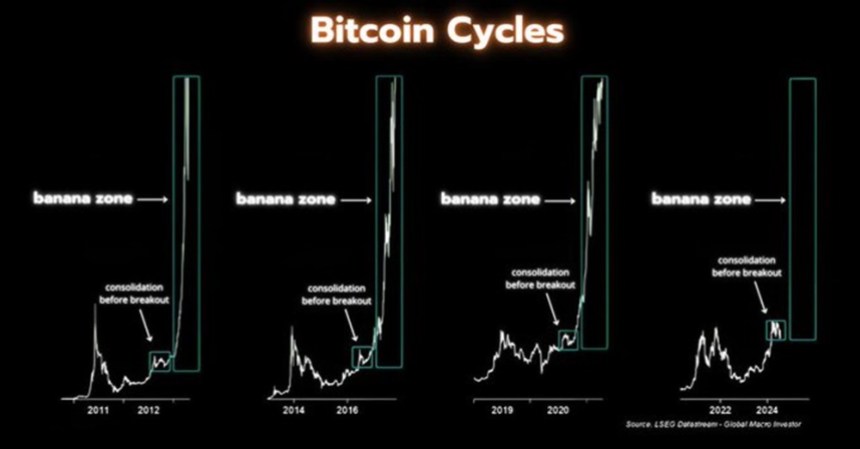
Notably, BTC has been moving between $55,000 – $70,000 over the last seven months which represents a state of consolidation.  According to Crypto Rover,  following a breakout from this current sideways movement, Bitcoin is likely to enter the “banana zone” i.e. the phase of outrageous price growth, as seen in previous bull cycles.


Bitcoin


The crypto analyst predicts that during this period which traditionally lasts for 12-18 months, BTC could trade as high as $290,000 representing a 339.39% gain on the asset’s current price.

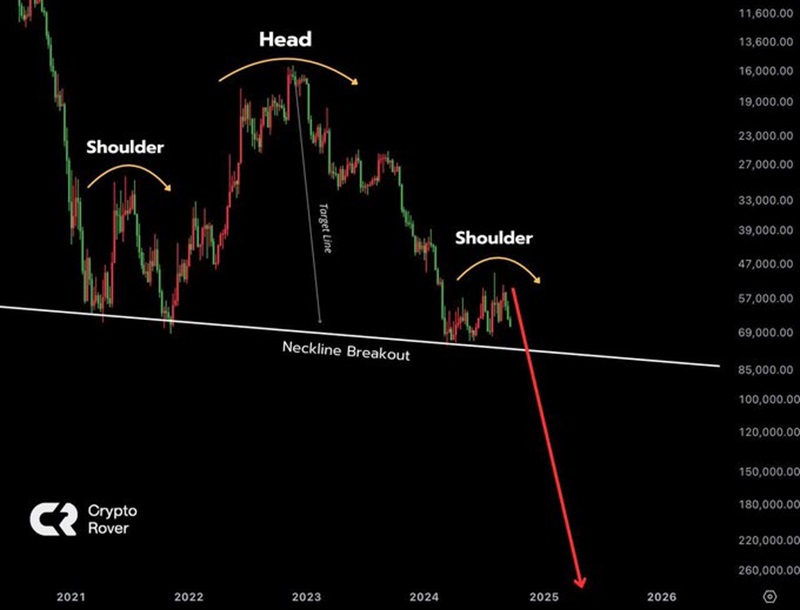
For many crypto enthusiasts, it is likely that the much-anticipated breakout will occur in the fast-approaching weeks as Bitcoin has now formed an inverse head and shoulders pattern as highlighted by Crypto Rover in another post. To explain, the inverse head and shoulders pattern is a common bullish indicator of potential reversals of a downtrend. If the price breaks above the neckline with significant volume, it indicates a shift to bullish control.

These sentiments on a price breakout are further strengthened by the upcoming Q4 which has proven to be the most bullish period for Bitcoin with an average gain of 88% over the last 11 years.


Bitcoin

Bitcoin Exchange Stablecoins Ratio Shows Bullish Signal

In more positive news for the Bitcoin community, the Bitcoin Exchange Stablecoin Ratio is currently indicating a buy signal. According to CryptoQuant analyst with username EgyHash, this metric which measures BTC reserves (in USD) to the combined stablecoin reserves on exchange is currently at the low levels seen at the start of 2024.

EgyHash explains that a low ratio indicates traders have an increased buying power due to high stablecoin holdings which could translate into investments in Bitcoin, thus resulting in a price gain. Therefore, the current low Bitcoin Exchange Ratio adds to the list of bullish signals for Bitcoin investors.

At the time of writing, the premier cryptocurrency continues to trade at $66,064 with a 1.14% gain in the last day. Meanwhile, Bitcoin’s daily trading volume is down by 12.92% and valued at $32.01 billion.

Bitcoin

 Featured image from Cwallet, chart from Tradingview 

Dogecoin To The Moon? Trading Guru Sees A Bullish Breakout on the Horizon—Here’s Why

Meet Samuel Edyme, Nickname – HIM-buktu. A web3 content writer, journalist, and aspiring trader, Edyme is as versatile as they come. With a knack for words and a nose for trends, he has penned pieces for numerous industry player, including AMBCrypto, Blockchain.News, and Blockchain Reporter, among others.

Edyme’s foray into the crypto universe is nothing short of cinematic. His journey began not with a triumphant investment, but with a scam. Yes, a Ponzi scheme that used crypto as payment roped him in. Rather than retreating, he emerged wiser and more determined, channeling his experience into over three years of insightful market analysis.

Before becoming the voice of reason in the crypto space, Edyme was the quintessential crypto degen. He aped into anything that promised a quick buck, anything ape-able, learning the ropes the hard way. These hands-on experience through major market events—like the Terra Luna crash, the wave of bankruptcies in crypto firms, the notorious FTX collapse, and even CZ’s arrest—has honed his keen sense of market dynamics.

When he isn’t crafting engaging crypto content, you’ll find Edyme backtesting charts, studying both forex and synthetic indices. His dedication to mastering the art of trading is as relentless as his pursuit of the next big story. Away from his screens, he can be found in the gym, airpods in, working out and listening to his favorite artist, NF. Or maybe he’s catching some Z’s or scrolling through Elon Musk’s very own X platform—(oops, another screen activity, my bad…)

Well, being an introvert, Edyme thrives in the digital realm, preferring online interaction over offline encounters—(don’t judge, that’s just how he is built). His determination is quite unwavering to be honest, and he embodies the philosophy of continuous improvement, or “kaizen,” striving to be 1% better every day. His mantras, “God knows best” and “Everything is still on track,” reflect his resilient outlook and how he lives his life.

In a nutshell, Samuel Edyme was born efficient, driven by ambition, and perhaps a touch fierce. He’s neither artistic nor unrealistic, and certainly not chauvinistic. Think of him as Bruce Willis in a train wreck—unflappable. Edyme is like trading in your car for a jet—bold. He’s the guy who’d ask his boss for a pay cut just to prove a point—(uhhh…). He is like watching your kid take his first steps. Imagine Bill Gates struggling with rent—okay, maybe that’s a stretch, but you get the idea, yeah. Unbelievable? Yes. Inconceivable? Perhaps.

Edyme sees himself as a fairly reasonable guy, albeit a bit stubborn. Normal to you is not to him. He is not the one to take the easy road, and why would he? That’s just not the way he roll. He has these favorite lyrics from NF’s “Clouds” that resonate deeply with him: “What you think’s probably unfeasible, I’ve done already a hundredfold.”

PS—Edyme is HIM. HIM-buktu. Him-mulation. Him-Kardashian. Himon and Pumba. He even had his DNA tested, and guess what? He’s 100% Him-alayan. Screw it, he ate the opp.

Shiba Inu Breakout Eyes $0.00002631 Level After Rallying Over 19%

Shiba Inu is experiencing a notable price breakout, surging over 19% and positioning itself toward the critical resistance level of $0.00002631. This significant rally indicates a shift in market momentum, characterized by robust buying pressure and increased trading volume. Technical indicators suggest that SHIB is establishing a bullish trend, with key support levels solidifying its upward trajectory. 

As Shiba Inu approaches this pivotal resistance zone, we will navigate its recent 19% breakout and its approach toward the critical resistance level of $0.00002631. By examining the underlying technical indicators, market sentiment, and key support levels, we will assess the strength of SHIB’s upward trajectory and explore whether this rally can sustain its upward trajectory in the face of market resistance.

Bullish Momentum Builds As Shiba Inu Targets Key Resistance

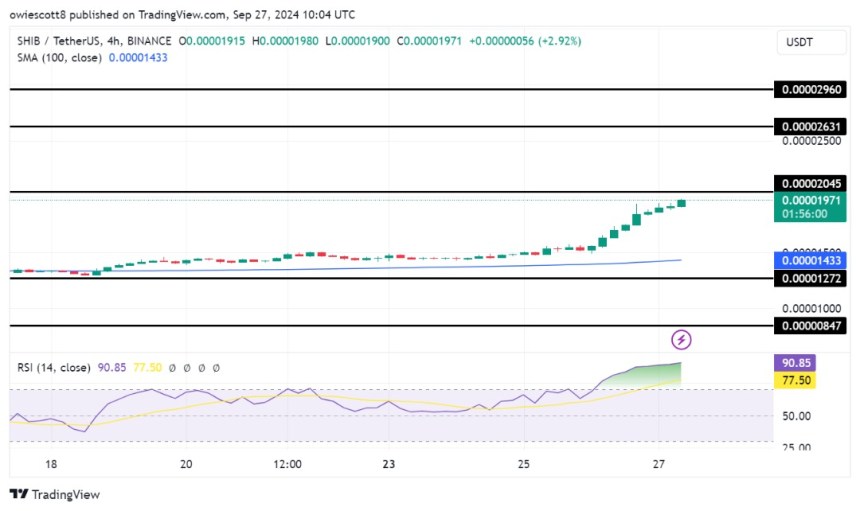
On the 4-hour chart, Shiba Inu trades above the SMA, showcasing strong bullish momentum as it approaches the $0.00002045 resistance level. Solid buying pressure combined with the formation of bullish candlesticks indicates a robust upward trajectory, making a test of this level highly likely.

Shiba Inu

An analysis of the 4-hour Relative Strength Index (RSI) indicates the potential for continued upward movement, with the RSI surpassing the 90% threshold and showing no signs of a near-term decline. This suggests that recent resilience is gaining strength and the positive trend may persist.

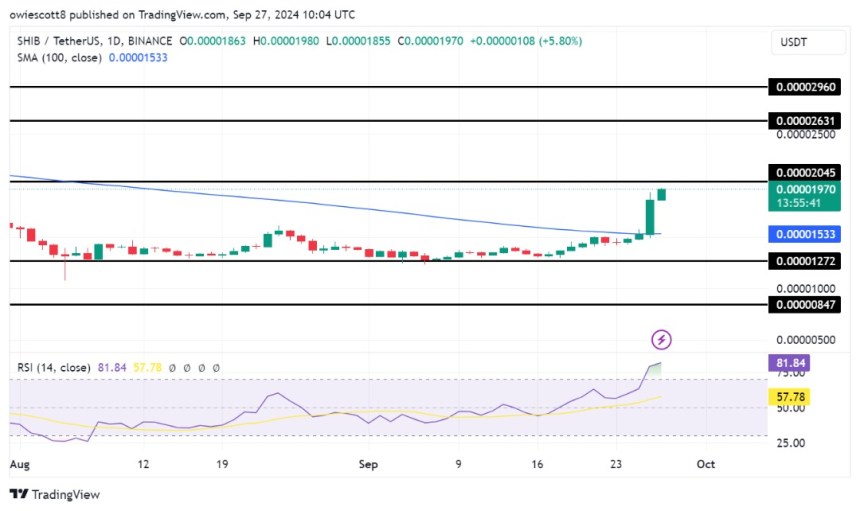
Also, SHIB has successfully crossed above the 100-day Simple Moving Average (SMA) on the daily chart, indicating a significant shift in its price momentum. Holding its position above this indicator demonstrates the asset’s resilience and reinforces its optimistic sentiment. The upward movement is not merely a momentary spike, it reflects strong buying interest and market confidence, suggesting that SHIB is poised for further gains.

Shiba Inu

On the daily chart, the RSI is positioned at 81%, reflecting that Shiba Inu is approaching overbought levels. While this shows robust buying pressure, it also raises the possibility of a potential pullback if the current upsurge weakens.

Will SHIB Break Through The $0.00002631 Barrier?

It is important to note that the $0.00002045 level serves as a critical junction for SHIB’s current surge. Should the meme coin manage to maintain its upward momentum and break through this barrier, it could pave the way for further gains toward the $0.00002631 resistance level and beyond.

Nonetheless, failure to break through the barrier could lead to a retracement to the previous support level of $0.00001272. When this level is breached, it may trigger deeper declines, potentially dropping toward $0.00000847 and other lower ranges.

With a market capitalization exceeding $11 billion and a trading volume of over $1.3 billion, SHIB was trading at approximately $0.00001951, reflecting a 19.6% increase at the time of writing. Over the last 24 hours, its market cap has risen by 19.6%, while trading volume experienced a 101.33% increase.

Shiba Inu

MicroStrategy’s Bitcoin Bet Pays Off In Multiple Ways As Stock Surges 317%

Este artículo también está disponible en español.

MicroStrategy was shot into the limelight when it began publicly buying Bitcoin back in 2020. While it is not the only publicly listed company to do this, the company’s aggressive Bitcoin strategy set it apart from the rest. Four years later, MicroStrategy is now the public company with the largest BTC holdings in the world, recording over $5 billion in profit so far. However, the profit on the BTC holdings is not the only positive that has come from the company’s Bitcoin investment strategy.

MicroStrategy’s Stock Price Blows Up

MicroStrategy’s MSTR stock price has completed an incredibly successful year that has seen it perform the big hitters in the stock market. A year ago, the MSTR stock price was sitting at a low of $45. However, as the Bitcoin price recovered and the company’s BTC portfolio grew, so did the company’s stock price.

Related Reading

In only one year, the price surged more than 317% to reach a new all-time high of $192 back in March 2024, according to data from TradingView. This put it above its previous February 2000 peak of $139, making it its highest level in more than two decades. Interestingly, the surge to the $192 all-time high in March coincided with the the Bitcoin all-tine high of $73,750 in the same month.

This suggests that the MicroStrategy stock price is closely correlated with the Bitcoin price performance. It’s understandable given that Bitcoin has become the company’s largest holdings, meaning that as the Bitcoin price rises, so does the valuation of the company, translating to an increase in the stock price.

Currently sitting at $167 at the time of this writing, meaning it’s 16% down from its $192 all-time high. However, it is still 250% higher than its $45 price level a year ago. This puts it ahead of the likes of Apple which is up only 24% year to date and Amazon, with a 34% year-to-date increase. Even NVIDIA’s outstanding performance falls behind MicroStrategy, with a 155% year-to-date increase.

Padding Up With Bitcoin

Despite being four years in, MicroStrategy is not letting up on its Bitcoin purchases, with major purchases this year. In 2024 alone, the company has bought 63,079 BTC which cost around $4.04 billion to acquire. The most recent purchase was on September 20, when former CEO Michael Saylor announced that the company had purchased 7,420 BTC for $489 million. This has brought the company’s total BTC holdings to 252,200 for a whopping cost price of $9.9 billion.

Related Reading

Despite the already massive Bitcoin holding, accounting for more than 1.166% of the total supply, MicroStrategy plans to continue buying BTC. The company announced it was offering $700 million in convertible notes, which was later amended to $1 billion, the proceeds of which would be used to purchase more BTC.

As for the company’s plan for its massive BTC stash, Saylor has previously revealed that the company has no plans of selling soon. For now, the plan looks to be to buy as much BTC as possible to hold as a treasury asset.

Bitcoin price chart from Tradingview.com (MicroStrategy)
BTC price creating support above $65,000 | Source: BTCUSD on Tradingview.com

Featured image created with Dall.E, chart from Tradingview.com

XRP Price Trapped In Consolidation: Will Bulls Break Free?

Aayush Jindal, a luminary in the world of financial markets, whose expertise spans over 15 illustrious years in the realms of Forex and cryptocurrency trading. Renowned for his unparalleled proficiency in providing technical analysis, Aayush is a trusted advisor and senior market expert to investors worldwide, guiding them through the intricate landscapes of modern finance with his keen insights and astute chart analysis.

From a young age, Aayush exhibited a natural aptitude for deciphering complex systems and unraveling patterns. Fueled by an insatiable curiosity for understanding market dynamics, he embarked on a journey that would lead him to become one of the foremost authorities in the fields of Forex and crypto trading. With a meticulous eye for detail and an unwavering commitment to excellence, Aayush honed his craft over the years, mastering the art of technical analysis and chart interpretation.
As a software engineer, Aayush harnesses the power of technology to optimize trading strategies and develop innovative solutions for navigating the volatile waters of financial markets. His background in software engineering has equipped him with a unique skill set, enabling him to leverage cutting-edge tools and algorithms to gain a competitive edge in an ever-evolving landscape.

In addition to his roles in finance and technology, Aayush serves as the director of a prestigious IT company, where he spearheads initiatives aimed at driving digital innovation and transformation. Under his visionary leadership, the company has flourished, cementing its position as a leader in the tech industry and paving the way for groundbreaking advancements in software development and IT solutions.

Despite his demanding professional commitments, Aayush is a firm believer in the importance of work-life balance. An avid traveler and adventurer, he finds solace in exploring new destinations, immersing himself in different cultures, and forging lasting memories along the way. Whether he’s trekking through the Himalayas, diving in the azure waters of the Maldives, or experiencing the vibrant energy of bustling metropolises, Aayush embraces every opportunity to broaden his horizons and create unforgettable experiences.

Aayush’s journey to success is marked by a relentless pursuit of excellence and a steadfast commitment to continuous learning and growth. His academic achievements are a testament to his dedication and passion for excellence, having completed his software engineering with honors and excelling in every department.

At his core, Aayush is driven by a profound passion for analyzing markets and uncovering profitable opportunities amidst volatility. Whether he’s poring over price charts, identifying key support and resistance levels, or providing insightful analysis to his clients and followers, Aayush’s unwavering dedication to his craft sets him apart as a true industry leader and a beacon of inspiration to aspiring traders around the globe.

In a world where uncertainty reigns supreme, Aayush Jindal stands as a guiding light, illuminating the path to financial success with his unparalleled expertise, unwavering integrity, and boundless enthusiasm for the markets.

Here Is Why The Bitcoin Bull Run Hasn’t Started, According To Analyst

The Bitcoin community have been eagerly awaiting the start of a new bull market especially following the recent halving that occurred in April, however, according to a latest analysis from a CryptoQuant analyst under the pseudonym Onchained, that moment has not yet arrived and there is a reason.

In the post uploaded on the CryptoQuant QuickTake platform, Onchained’s analysis focused on the Long-Term Holder (LTH) Mourad Ratio, a proprietary indicator that tracks UTXOs (unspent transaction outputs) held for more than six months.

This ratio basically helps gauge market sentiment and accumulation trends among long-term Bitcoin holders, offering valuable insights into when BTC may enter its next bull phase.

Stability In The Long-Term Holder Mourad Ratio

One of the key indicators highlighted in the analysis is the stability of the Long-Term Holder Mourad Ratio. Historically, when this ratio remains stable, it suggests that the market is not yet ready for a significant upward movement.

Onchained explained that a bull market typically begins only when the ratio starts to deviate negatively from these stable levels. Currently, data shows that the LTH Mourad Ratio is steady, signaling that Bitcoin’s bull run is yet to begin.

Bitcoin Long-Term Holder (LTH) Mourad Ratio.

This stableness in the ratio as revealed by the analyst,  indicates that long-term holders are not yet driving substantial price movement in the market, and investors may need to exercise patience until more favourable conditions arise.

For further context, the Mourad Ratio is calculated by dividing the Long-Term Holder Mourad Current Transaction Value (LTH MCTV) by the current Bitcoin price.

This calculation provides insight into the average value of UTXOs aged over six months, giving a clearer picture of recent accumulation trends among longer-term BTC holders.

Bitcoin (BTC) price chart on TradingView

Technicals Suggests Bitcoin Bull Run Is Not So Far

While Onchained analysis has confirmed that Bitcoin bull run is yet to start, other analysts has turned to historical price chart to gauge when the bull run for BTC could begin from a technical perspective.

Popular Bitcoin insight platform known as Bitcoin archive on X has recently highlighted that BTC is on the verge of making a “bullish cross-over on the 5-day chart for the first time in 230 days.”

According to Bitcoin Archive, the last two times this happened, BTC went up by 79% and 74%, therefore, should this repeat itself again, Bitcoin could surge past $100,000.

Featured image created with DALL-E, Chart from TradingView


Is the Uptrend Still Safe?

Este artículo también está disponible en español.

Bitcoin price started a downside correction from the $64,750 resistance. BTC is still above the $62,500 support and might aim for a fresh increase.

  • Bitcoin is consolidating gains below the $63,800 resistance zone.
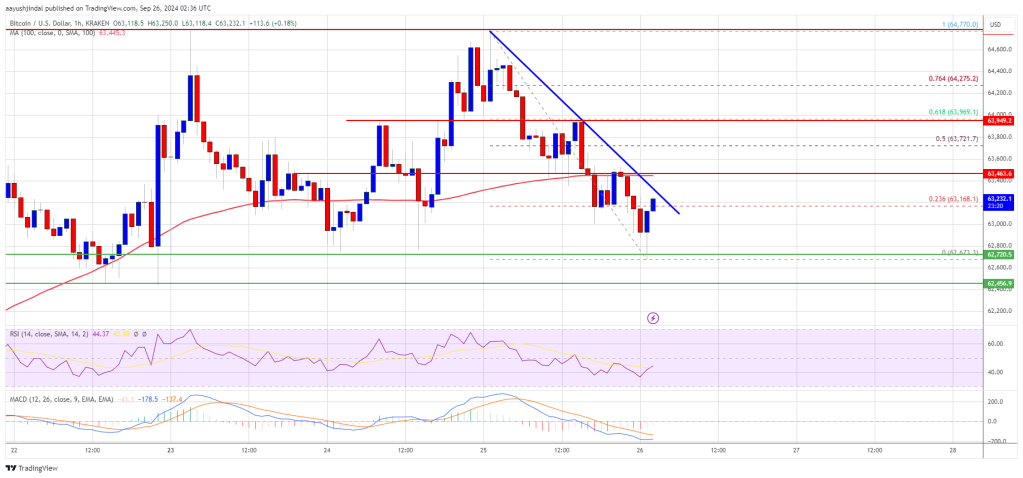
  • The price is trading below $63,500 and the 100 hourly Simple moving average.
  • There is a connecting bearish trend line with resistance at $63,300 on the hourly chart of the BTC/USD pair (data feed from Kraken).
  • The pair could start another increase if there is a clear move above the $63,700 resistance zone.

Bitcoin Price Revisits $62,500

Bitcoin price started a downside correction after it failed to clear the $64,750 zone. BTC dipped below the $64,000 and $63,500 support levels. There was also a spike below $63,000.

A low was formed at $63,673 and the price is now consolidating losses. There was a move above the $63,000 level. The price climbed above the 23.6% Fib retracement level of the downward move from the $64,770 swing high to the $62,673 low.

Bitcoin is now trading below $63,500 and the 100 hourly Simple moving average. If there is a fresh increase, the price could face resistance near the $63,250 level. There is also a connecting bearish trend line with resistance at $63,300 on the hourly chart of the BTC/USD pair.

Bitcoin Price
Source: BTCUSD on TradingView.com

The first key resistance is near the $63,700 level. A clear move above the $63,700 resistance might send the price higher. The next key resistance could be $64,000 or the 61.8% Fib retracement level of the downward move from the $64,770 swing high to the $62,673 low. A close above the $64,000 resistance might spark more upsides. In the stated case, the price could rise and test the $64,750 resistance level.

More Losses In BTC?

If Bitcoin fails to rise above the $63,700 resistance zone, it could continue to move down. Immediate support on the downside is near the $63,000 level.

The first major support is near the $62,500 level. The next support is now near the $62,000 zone. Any more losses might send the price toward the $61,200 support in the near term.

Technical indicators:

Hourly MACD – The MACD is now losing pace in the bullish zone.

Hourly RSI (Relative Strength Index) – The RSI for BTC/USD is now below the 50 level.

Major Support Levels – $63,000, followed by $62,500.

Major Resistance Levels – $63,600, and $64,000.

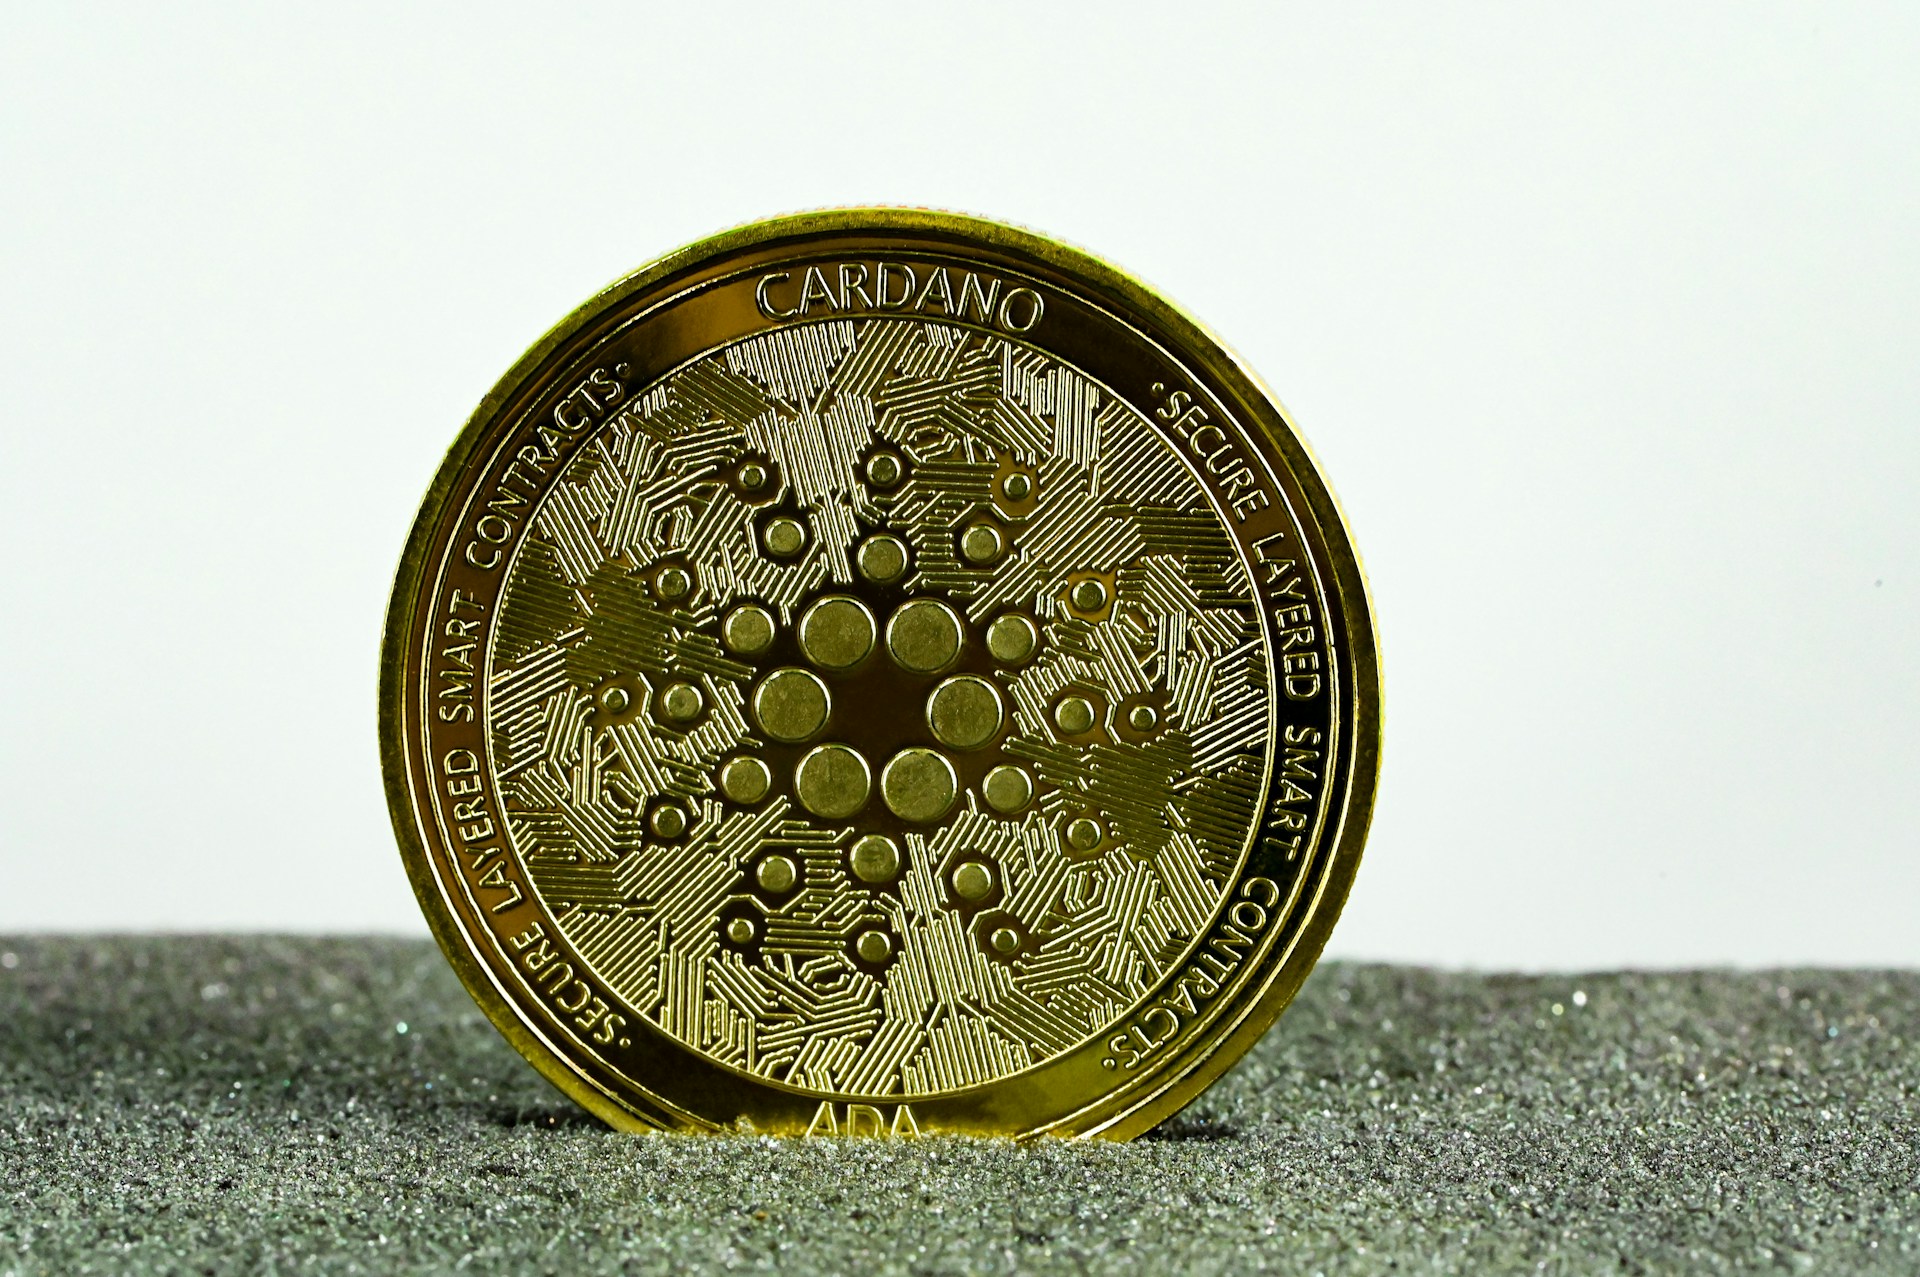
Cardano Reclaims Top 10 Crypto Spot, Analysts Set New Targets

Rubmar is a writer and translator who has been a crypto enthusiast for the past four years. Her goal as a writer is to create informative, complete, and easily understandable pieces accessible to those entering the crypto space. After learning about cryptocurrencies in 2019, Rubmar became curious about the world of possibilities the industry offered, quickly learning that financial freedom was at the palm of her hand with the developing technology.

From a young age, Rubmar was curious about how languages work, finding special interest in wordplay and the peculiarities of dialects. Her curiosity grew as she became an avid reader in her teenage years. She explored freedom and new words through her favorite books, which shaped her view of the world. Rubmar acquired the necessary skills for in-depth research and analytical thinking at university, where she studied Literature and Linguistics. Her studies have given her a sharp perspective on several topics and allowed her to turn every stone in her investigations.

In 2019, she first dipped her toes in the crypto industry when a friend introduced her to Bitcoin and cryptocurrencies, but it wasn’t until 2020 that she started to dive into the depth of the industry. As Rubmar began to understand the mechanics of the crypto sphere, she saw a new world yet to be explored.

At the beginning of her crypto voyage, she discovered a new system that allowed her to have control over her finances. As a young adult of the 21st century, Rubmar has faced the challenges of the traditional banking system and the restrictions of fiat money.

After the failure of her home country’s economy, the limitations of traditional finances became clear. The bureaucratic, outdated structure made her feel hopeless and powerless amid an aggressive and distorted system created by hyperinflation. However, learning about decentralization and self-custody opened a realm of opportunities. Cryptocurrencies allowed her to experience financial control for the first time and expand her financial education.

Moreover, the peculiar nature of the crypto community sparked Rubmar’s curiosity about the other layers of the industry. As a result, she found a particular interest in discovering the diverse perspectives of investors, market watchers, experts, and developers. Her attempts to better understand the crypto space made her realize the strong links of the community with other industries, enriching her perspective of the sector. As someone who spends most of her day online, Rubmar enjoys finding the points where the crypto world meets with her other passions and hobbies ­–or her favorite memes.

In her free time, she usually finds joy in different art forms. As a child, she enlisted in every extra-curricular activity in her hometown, including music classes, dancing, jewelry making, and the local chorus. Despite her many attempts to learn different instruments, Rubmar only knows how to play the xylophone, which she played for 7 years in her school’s marching band.

She also has a passion for learning new languages and cultures, having set the goal to learn another six languages ­– currently attempting to learn Italian and Korean. Scrapbooking, paper crafting, and bookbinding are her biggest interests outside of work, constantly taking classes and attending workshops to learn new techniques. The rest of her free time is spent stressing over football matches and transfer market news or feeding cats –hers or stray.

In summary, Rubmar seeks to present entertaining and educational pieces to be enjoyed by everybody, aiming to report on the latest news and offer a unique perspective while adding a meme or a pun whenever possible.