Month: November 2024

Total Value Locked Hits $5.7 Billion, Ranks Third Among Networks

Este artículo también está disponible en español.

A recent report from crypto data and research firm Messari has shed light on the performance of the Solana (SOL) ecosystem during the third quarter of 2024. The report highlights a mixture of growth and challenges faced by the blockchain amid broader volatility in the cryptocurrency market during that period.

Solana Stablecoin Market Cap Rises To $3.8 Billion

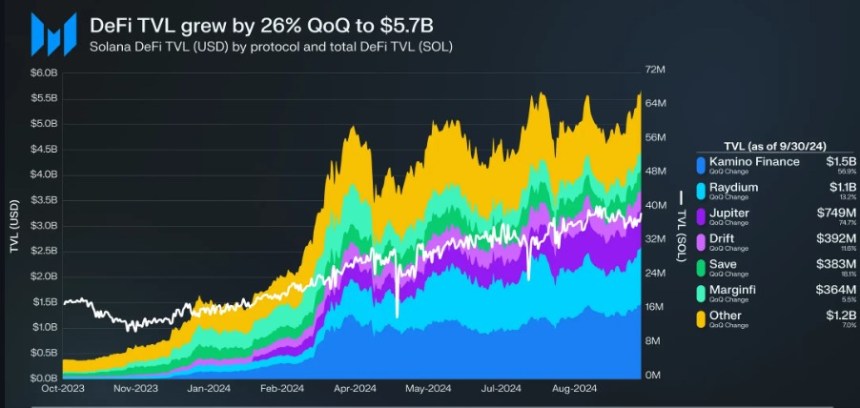
One of the standout metrics from the report is the growth of Solana’s Total Value Locked (TVL) in decentralized finance (DeFi), which rose by 26% quarter-over-quarter (QoQ) to reach $5.7 billion. 

This growth positioned Solana as the third-largest network in terms of DeFi TVL, surpassing Tron in late September. Notably, the TVL denominated in SOL also increased, growing by 20% QoQ to 37 million SOL.

Related Reading
Solana
Solana’s Q3 TVL growth. Source: Messari

Kamino emerged as a leading player within the Solana ecosystem, experiencing a 57% growth in TVL, ending the quarter with $1.5 billion and capturing a 26% market share. This surge is attributed to the integration of new tokens, including PayPal’s USD (PYUSD) and jupSOL, which have enhanced the platform’s appeal.

Despite the overall positive trends, decentralized exchange (DEX) volume experienced a slight decline, reflecting a downturn in memecoin trading. Average daily spot DEX volume fell by 10% QoQ to $1.7 billion. 

Per the report, the diminishing interest in memecoins was evident, as only two tokens—WIF and POPCAT—managed to make it into the top ten by trading volume for the quarter.

In contrast, Solana’s stablecoin ecosystem showed resilience, with the market cap for stablecoins growing by 23% QoQ to $3.8 billion, solidifying its rank as the fifth-largest network in this category. 

On the non-fungible token (NFT) front, however, the performance was less favorable. Average daily NFT volume fell by 27% QoQ to $2.5 million, with Magic Eden maintaining a dominant market share despite experiencing a 44% decline in volume. 

Network Activity Thrives

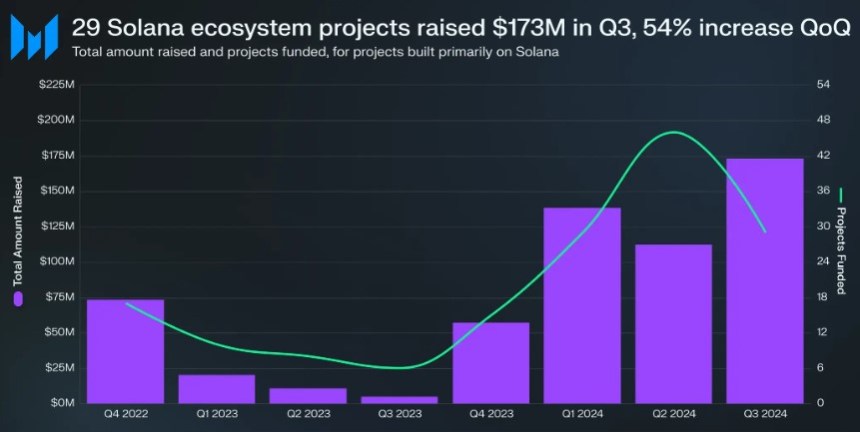
Despite the challenges, the number of funding rounds for projects within the Solana ecosystem saw a reduction of 37% QoQ, with only 29 projects announcing funding. Yet, the total amount raised soared to $173 million, a 54% increase QoQ and the highest quarterly funding since Q2 2022.
Solana
Funding growth in the Solana blockchain during Q3. Source: Messari

Network activity remained robust, as evidenced by a 109% increase in average daily fee payers, which reached 1.9 million. Additionally, the average daily new fee payers grew by 430% QoQ to 1.3 million, signaling a growing user base. 

Related Reading

The average transaction fee on Solana increased by 6% QoQ to 0.00015 SOL (approximately $0.023), while the median transaction fee dropped by 19% to 0.000008 SOL (around $0.0013). 

As of October 15, Solana’s market capitalization also grew by 5% QoQ, reaching $71 billion and maintaining its position as the fifth-largest cryptocurrency, trailing only Bitcoin, Ethereum, Tether, and Binance Coin. 

However, the Real Economic Value (REV) of Solana, which tracks transaction fees and miner extractable value (MEV) for validators, decreased by 25% QoQ to 1.3 million SOL (approximately $196 million), with 56% of this total coming from transaction fees.

Solana
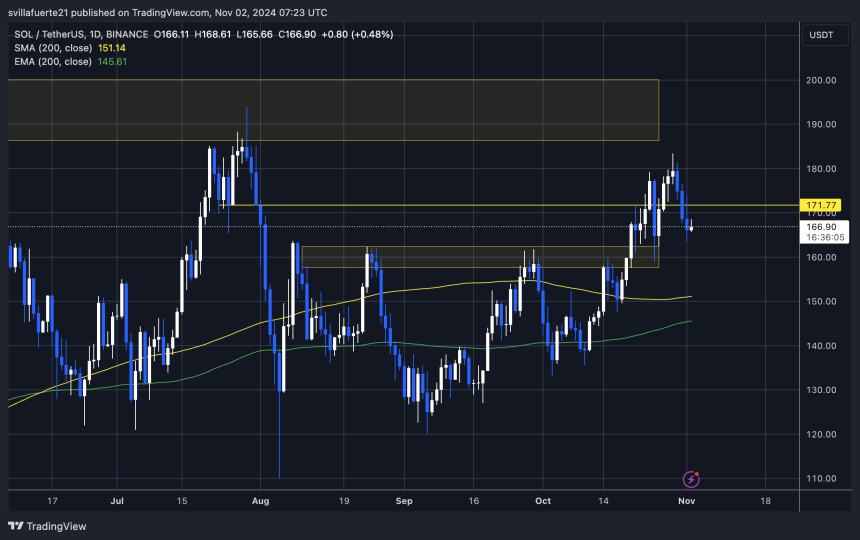
The daily chart shows SOL’s price retrace experienced over the past 72 hours. Source: SOLUSDT on TradingView.com

At the time of writing, SOL was trading at $166, down 5% for the seven day period.

Featured image from DALL-E, chart from TradingView.com 

Solana Headed For Correction Before Bounce – Analyst Sets $180 Target

Este artículo también está disponible en español.

Solana (SOL) is trading around a crucial demand level at $165, following a pullback from recent highs of $183. This level is pivotal for SOL, as losing it could trigger a deeper correction, putting the altcoin at risk of further downside. 

However, prominent analyst Carl Runefelt has shared technical analysis indicating that Solana may be primed for a brief correction before staging a rally to retest local highs.

Related Reading

Runefelt’s analysis highlights signs of renewed strength for SOL, suggesting that the altcoin is preparing for a move that could challenge recent highs within the next few days. This bullish setup depends heavily on Solana maintaining support at $165, which could act as a launchpad for further upward momentum. 

As the crypto market closely watches Bitcoin’s bid for a new all-time high, Solana investors are bracing for potential volatility. In this uncertain landscape, Solana remains a focal point for investors who see an opportunity if support holds steady. 

Solana Holding Key Demand Level

Solana (SOL) has emerged as one of the stronger-performing altcoins this cycle, drawing significant attention as it tests a key demand level that could drive it toward new highs. Prominent analyst and investor Carl Runefelt recently shared a technical analysis on X, indicating that SOL may briefly dip to around $160 before staging a push to retest its recent high at $180.

According to Runefelt, this $160 level represents a critical support zone for Solana, as holding above it is essential to sustain the altcoin’s bullish momentum and confirm its ongoing uptrend. Runefelt’s analysis emphasizes the importance of this support level in fueling Solana’s potential for gains, suggesting that it could serve as a springboard for a substantial rally. 

Solana facing a small correction before a move to $180
Solana facing a small correction before a move to $180 | Source: Carl Runefelt on X

If SOL successfully holds above $160, a surge to test local highs would not only reinforce confidence among investors but also set the stage for Solana to push into new territory if broader market conditions remain favorable.

The coming week could prove pivotal for SOL as the market braces for heightened volatility with the US election on the horizon (Nov 5) and Bitcoin nearing its all-time high.

Related Reading

As investors monitor macro events and Bitcoin’s movements closely, Solana’s technical setup around $160 will be a focal point for those seeking to capitalize on the altcoin’s potential gains. If Solana maintains its bullish structure, it could play a key role in leading the altcoin market forward in this cycle.

SOL Technical Levels To Watch

Solana is trading at $166 after a slight rebound from the $163 level, maintaining a strong position above the critical $160 support zone. This level has proven to be a vital threshold for SOL, as a sustained hold here could set the stage for a rally toward higher resistance levels. 

SOL holding above the $160 mark
SOL holding above the $160 mark | Source: SOLUSDT chart on TradingView

If buyers successfully defend $160, it may serve as the foundation for a climb to $183 and potentially beyond, with higher supply zones likely to be tested.

Related Reading

Analysts are watching this level closely, as it could either reinforce SOL’s bullish structure or signal the need for further consolidation. A breakdown below $160, however, would likely lead to a deeper correction, prompting traders to recalibrate their expectations as Solana seeks lower support levels. The next few days will be crucial as the market evaluates SOL’s strength at $160 and prepares for potential moves to new highs.

Featured image from Dall-E, chart from TradingView

Bitcoin Price Correction Triggers $296 Million In Liquidations – Can BTC Still Hit ATH?

Este artículo también está disponible en español.

Bitcoin (BTC) has had a volatile 24 hours, hitting as low as $68,830 on the Binance crypto exchange before recovering some losses.

Liquidation Data At A Glance

Although BTC is trading close to its all-time high (ATH) value of $73,737, yesterday’s quick drop in price cast doubts on whether the top digital asset will be able to record a new ATH.

Related Reading

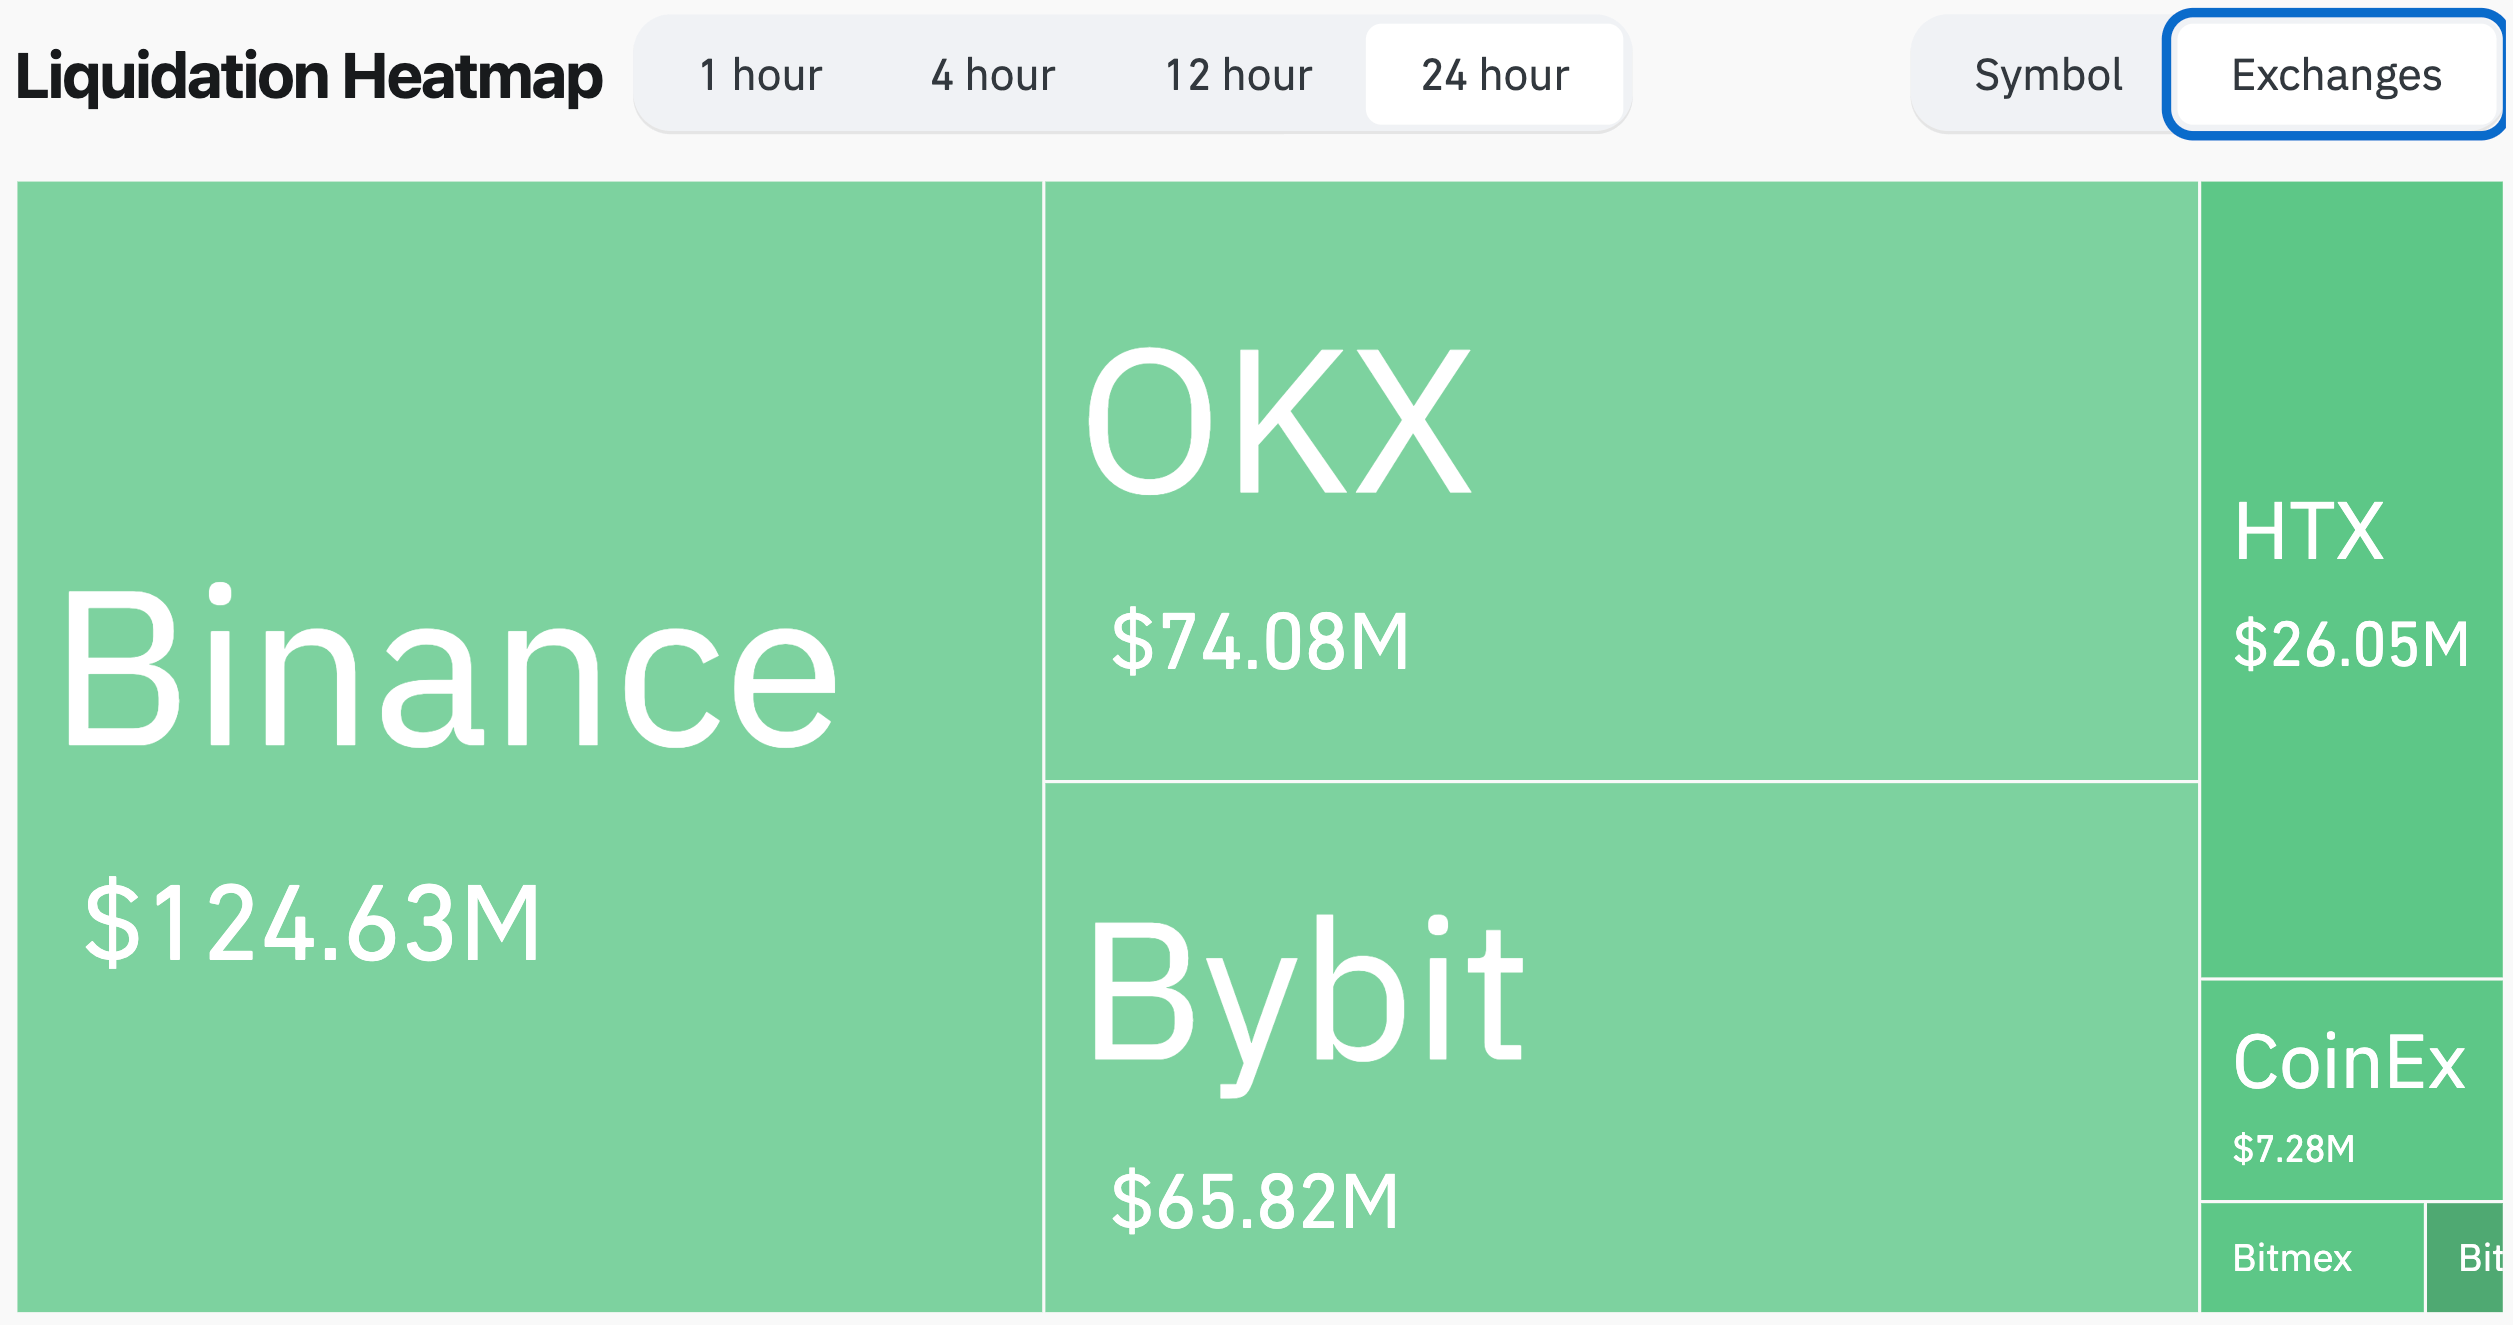
According to CoinGlass data from the crypto liquidations tracker, more than $296 million of active positions were liquidated in the last 24 hours. 

Nearly 77% were long positions, indicating that traders were largely betting on BTC’s continued upward momentum. Binance saw the most liquidations at $124 million, followed by OKX with $74 million and Bybit with $65 million.

crypto exchanges
Source: CoinGlass

In digital assets, Bitcoin led with over $97 million worth of positions liquidated, followed by Ethereum (ETH) at $47 million, and Solana at nearly $17 million.

With yesterday’s slump, the total crypto market cap has shrunk by about 3.5%, currently valued at $2.48 trillion. It is worth noting that although BTC is close to its ATH, the total crypto market cap is still considerably far from its ATH of $2.98 trillion recorded in November 2021.

The gap between BTC’s performance and the overall market cap suggests that altcoins have not kept pace with BTC’s recent gains, contributing to the disparity. This could also indicate a cautious investor sentiment, favoring BTC over altcoins during uncertain periods.

At the same time, it suggests that there is still a lot of room for altcoins to grow, which could tempt some more risk-seeking investors to accumulate altcoins in hopes of extraordinary gains relative to BTC.

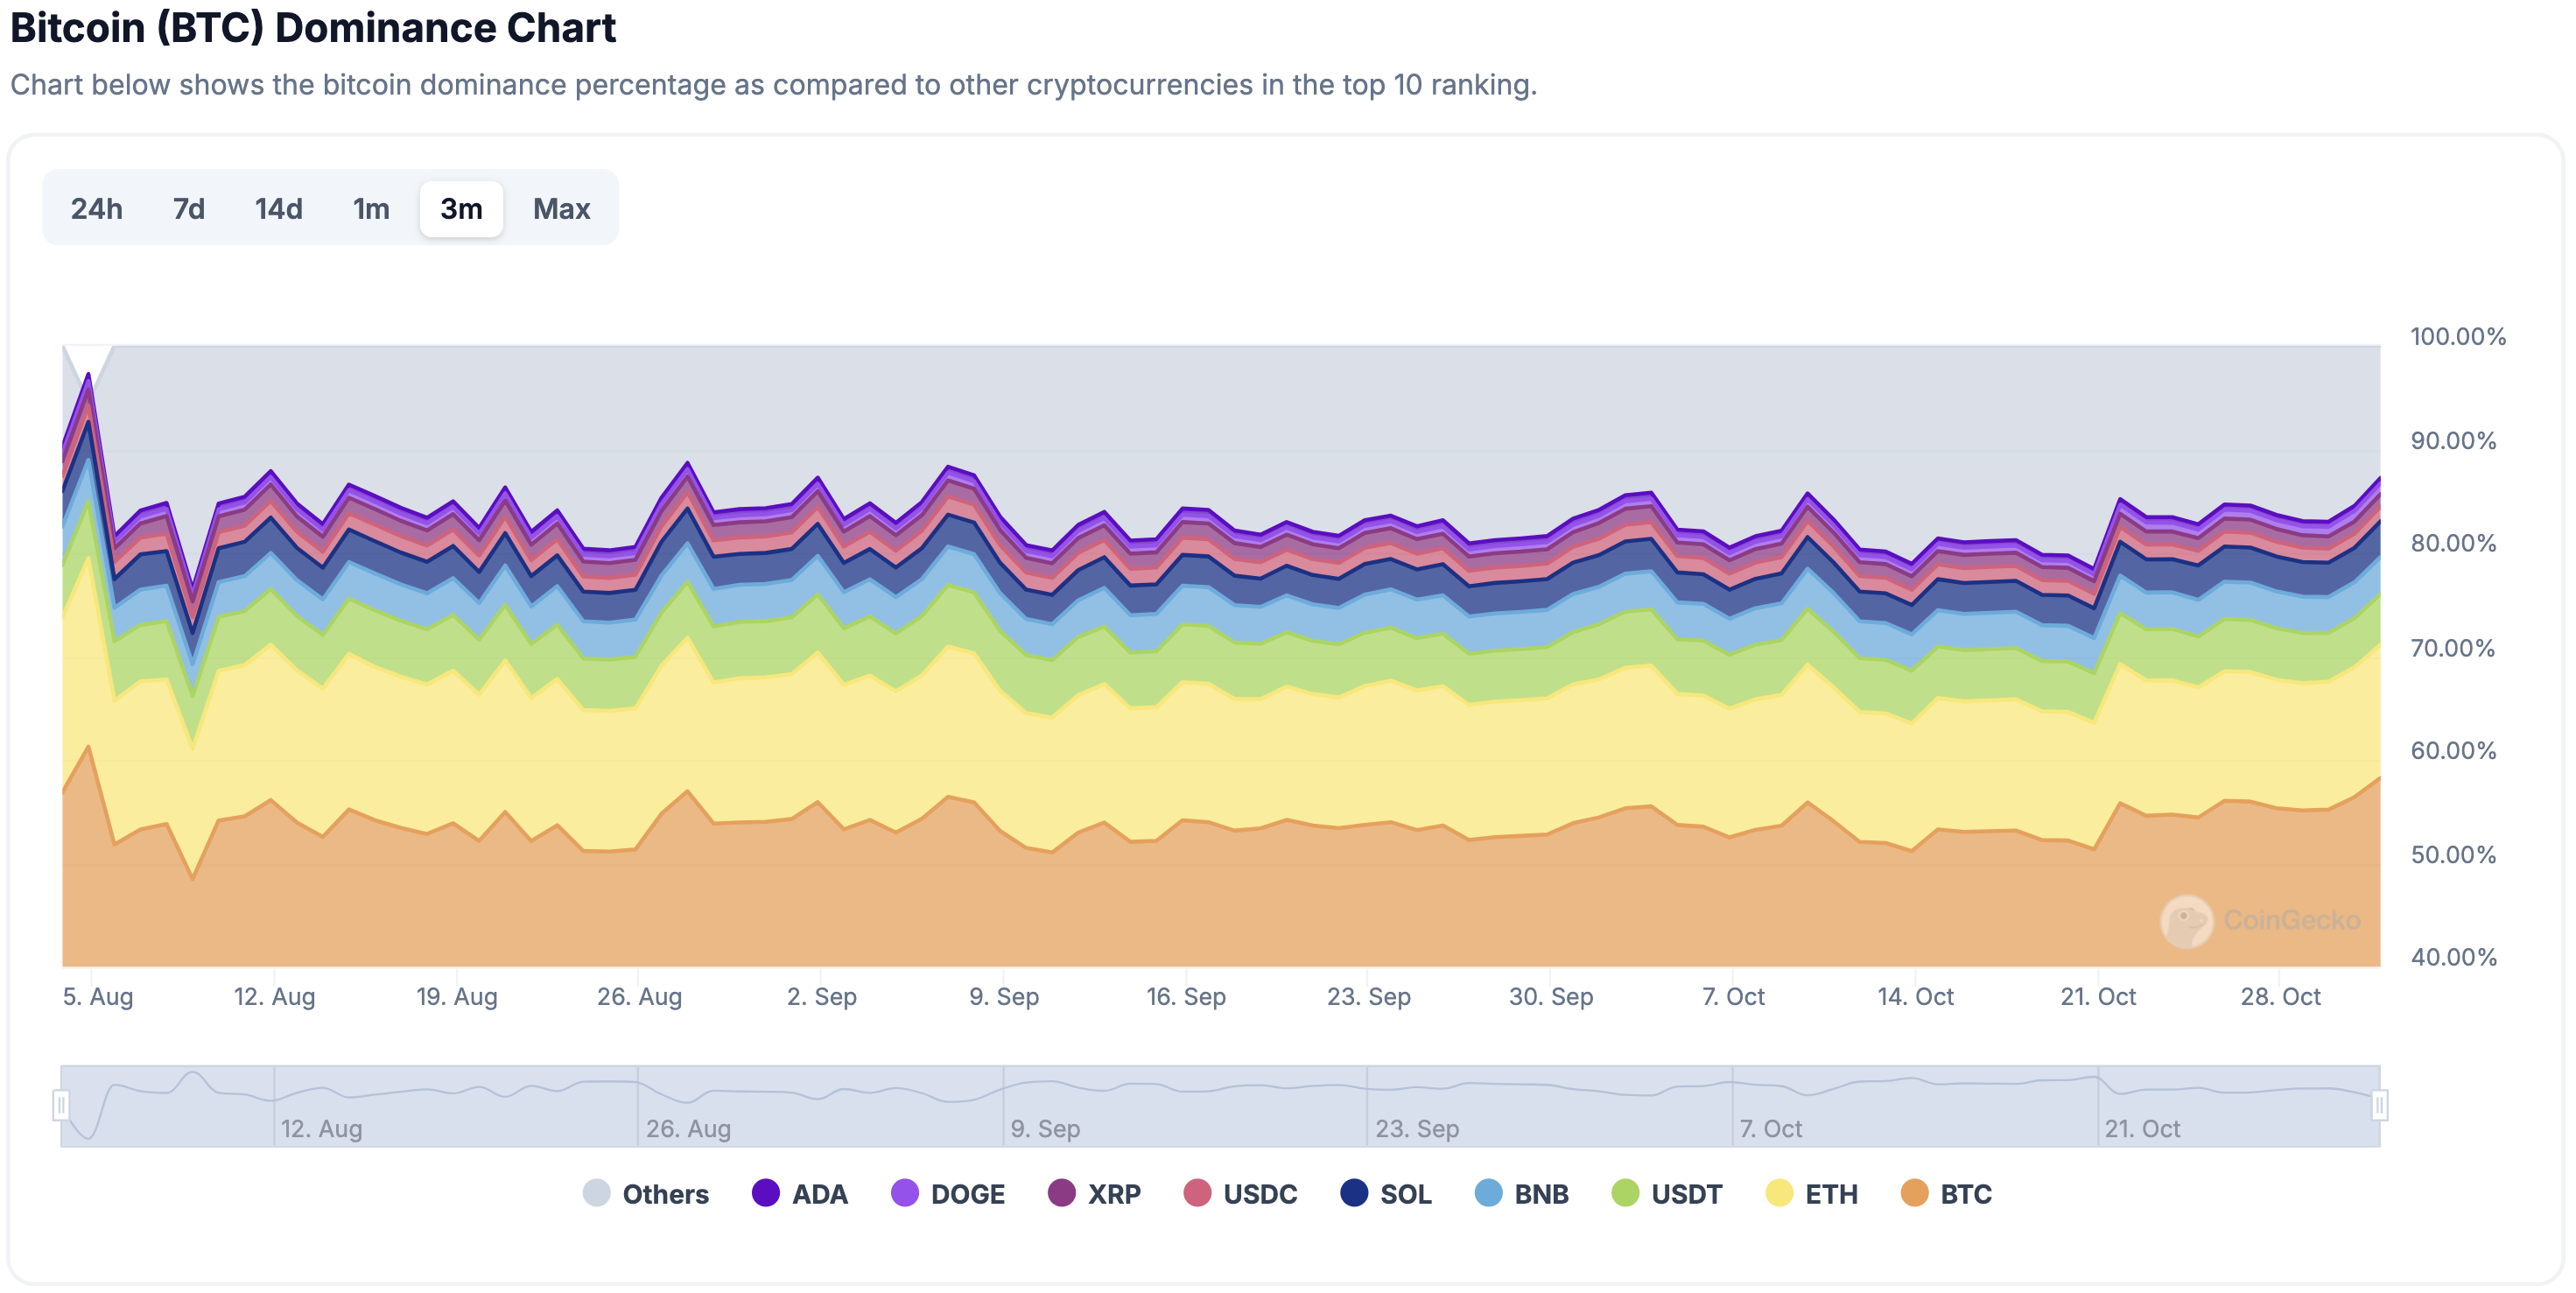
That said, Bitcoin dominance – a metric that gauges the proportion of the overall crypto market cap commanded by BTC – is steadily climbing toward 60%. A higher BTC dominance could spell disaster for altcoins already trailing BTC in price action.

btc dominance
Source: CoinGecko

Can Bitcoin Still Hit ATH?

The question on the minds of crypto enthusiasts is whether BTC will achieve a new ATH during this rally. The answer is not straightforward.

Related Reading

Factors supporting a potential new ATH include the increased likelihood of pro-crypto US presidential candidate Donald Trump winning the election, the effects of BTC halving, increased inflows to BTC exchange-traded funds (ETF), and a low interest rate environment.

On the contrary, sentiment indicators like the Fear and Greed Index suggest the market is still in a ‘greed’ phase, hinting that there could be more pain for the market before the next leg up.

Regardless of the outcome, the crypto market will likely remain volatile in the coming days. However, long-term BTC holders do not appear fazed by this prospect, as profit-taking remained relatively muted when the digital asset crossed $71,000.

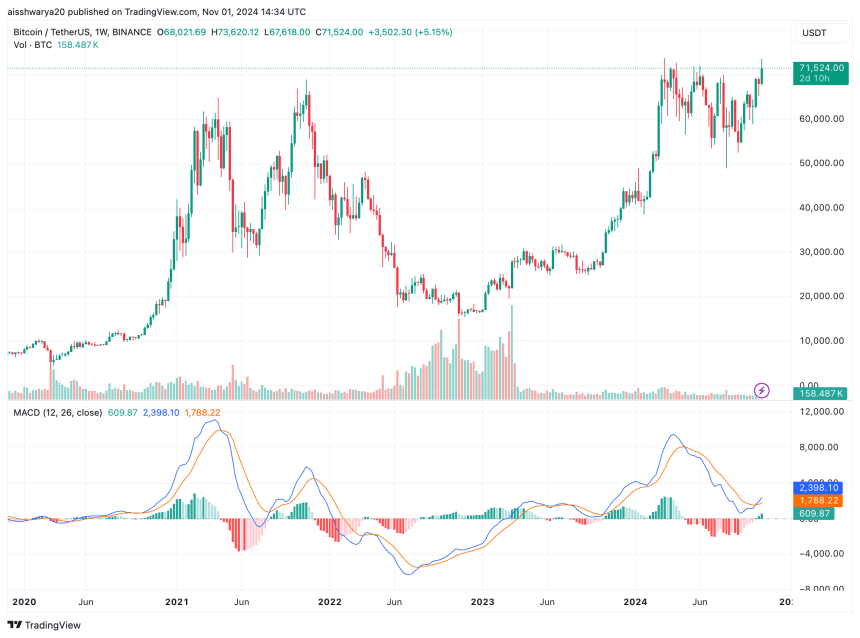
At press time, BTC trades at $71,524, up a modest 0.6% in the past 24 hours, with a reported market cap of $1.41 trillion.

bitcoin
BTC trades at $71,524 on the daily chart | Source: BTCUSDT on TradingView.com

Featured image from Unsplash, Charts from CoinGecko, CoinGlass, and Tradingview.com

Ethereum Claims Address Dominance With 43% Lead—Will It Keep Rising?

Este artículo también está disponible en español.

Ethereum missed out on this week’s crazy price movements. For the last couple of days, Bitcoin has dominated the bigger crypto market, making gigantic strides almost crossing the $73,500 mark for its best in recent months. Other altcoins have also followed that trajectory as SOL and DOGE trail Bitcoin.

Related Reading

As Bitcoin retests a new high this October, Ethereum lags, even touching a low of $2,322 last October 3rd. Since then, Ether has slowly inched its way up the price charts, reaching as high as $2,721, before re-tracing the $2,500 level.

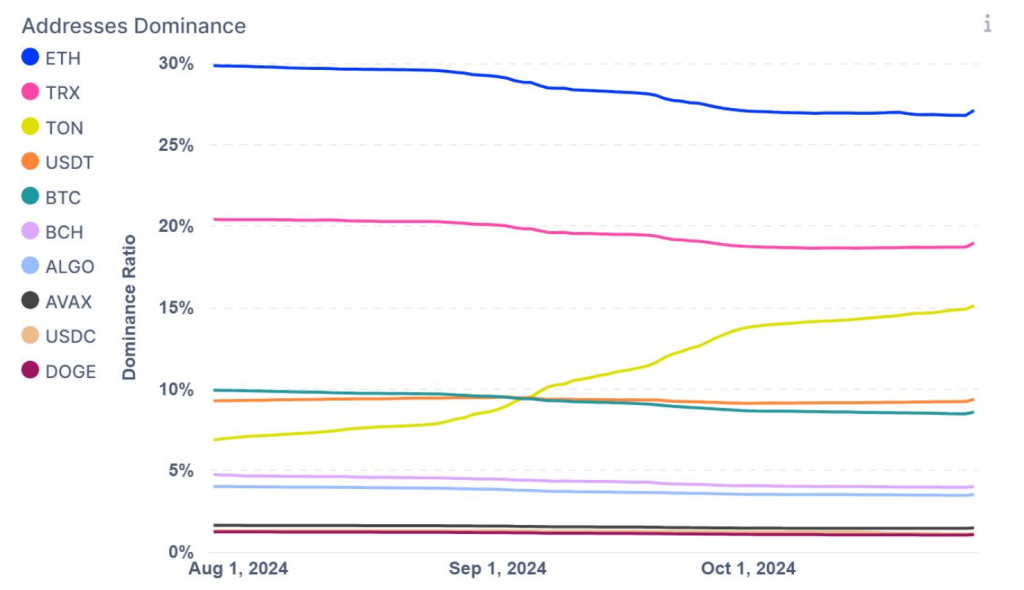
Analysts say Ether’s recent move is due to increased on-chain activities. Based on IntoTheBlock data, Ethereum’s blockchain has seen an increase in addresses, beating other ecosystems. The blockchain accounts for 43% of all active addresses, leading other popular blockchain projects like BTC, TRX, TON, and USDT.

Ethereum Addresses Dominate

The active addresses in a blockchain are an important metric that analysts check to gauge the blockchain’s popularity. According to InTheBlock tracking, the Ethereum blockchain remains the leader, accounting for 43% of all active addresses.

ETH is currently trading at $2,510. Chart: TradingView

Tron comes in second, with a 27% share of all active addresses. TON by Telegram is also in the Top 5 list of InTheBlock as of October 1st, and it offers an interesting picture of an increasing user base.

Other tokens making significant inroads in active addresses are USDT by Tether and Toncoin. Analysts say this data indicates Ethereum’s dominance, particularly in adoption and network activity.

Related Reading

Can We Expect An ETH Price Rally Soon?

Recent data from active addresses reveal that currently, Ethereum is the most active blockchain. The strength of demand and interest for DeFi projects, dApps, and even NFTs can be ascribed to activity in its ecosystem.

As some blockchain analysts note, improving network activity and adoption often increases prices. ETH can surprise with increased active addresses and prevailing market conditions. Other on-chain data support the blockchain. For example, its Exchange Supply Ratio is down to 0.141 from 0.145, increasing accumulation.

What To Expect From Ethereum In The Next Few Days

Currently, ETH trades at $2,516, which has a weekly gain of 3.74%. There are also an increasing number of active addresses and strong uptrend. Analysts predict ETH to retest the mark of $2,800 in the coming weeks or months.

Featured image from Bankrate, chart from TradingView


Solana (SOL) Slides to Support: Bulls Ready to Defend?

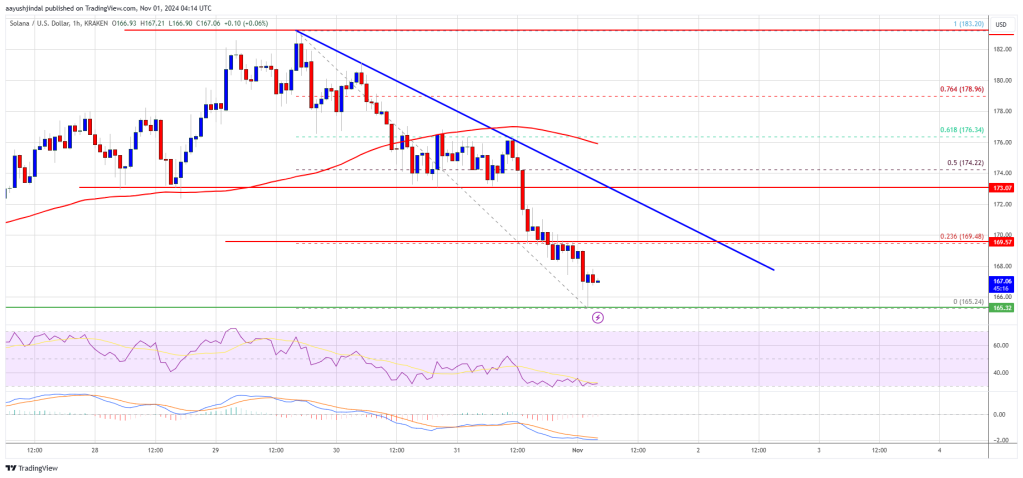
Solana trimmed gains and traded below the $175 support zone. SOL price is now approaching the $165 support and might bounce back in the near term.

  • SOL price started a fresh decline after it struggled near the $185 zone against the US Dollar.
  • The price is now trading below $172 and the 100-hourly simple moving average.
  • There is a key bearish trend line forming with resistance at $172 on the hourly chart of the SOL/USD pair (data source from Kraken).
  • The pair could start a decent upward movement if it stays above the $165 and $162 support levels.

Solana Price Holds Support

Solana price struggled to clear the $185 resistance and started a fresh decline like Bitcoin and Ethereum. There was a drop below the $180 and $175 support levels.

The bears even pushed the price below $172 and tested the $165 support zone. A low was formed at $165 and the price is now consolidating losses below the 23.6% Fib retracement level of the downward move from the $183 swing high to the $165 low.

Solana is now trading below $172 and the 100-hourly simple moving average. On the upside, the price is facing resistance near the $170 level. The next major resistance is near the $172 level. There is also a key bearish trend line forming with resistance at $172 on the hourly chart of the SOL/USD pair.

Solana Price

The main resistance could be $175 or the 50% Fib retracement level of the downward move from the $183 swing high to the $165 low. A successful close above the $175 resistance level could set the pace for another steady increase. The next key resistance is $182. Any more gains might send the price toward the $185 level.

More Losses in SOL?

If SOL fails to rise above the $170 resistance, it could continue to move down. Initial support on the downside is near the $165 level. The first major support is near the $162 level.

A break below the $162 level might send the price toward the $150 zone. If there is a close below the $150 support, the price could decline toward the $135 support in the near term.

Technical Indicators

Hourly MACD – The MACD for SOL/USD is gaining pace in the bearish zone.

Hourly Hours RSI (Relative Strength Index) – The RSI for SOL/USD is below the 50 level.

Major Support Levels – $165 and $162.

Major Resistance Levels – $170 and $172.