Author: ADM

Major Hindrances To Dogecoin Price Hitting $1 According To This Crypto Analyst

Este artículo también está disponible en español.

A crypto analyst, identified as ‘Trading Jesus’ on X (formerly Twitter), unveiled the roadmap for the Dogecoin price to reach $1. By highlighting Dogecoin’s resistance and support levels, the analyst has underscored the major hindrance to the meme coin hitting the $1 milestone

Dogecoin Price Roadmap To The $1 Target

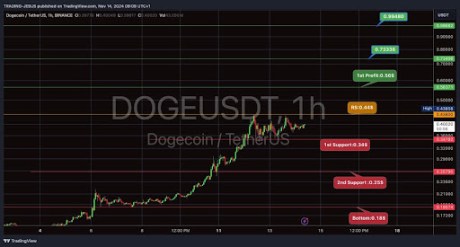
In his X post, Trading Jesus shared a Dogecoin chart on the 1-hour timeframe showing the support and resistance levels as the Dogecoin price aims for the $1 mark. Currently trading at $0.36, the crypto analyst has indicated that the next resistance level for Dogecoin is $0.44. 

Related Reading
Dogecoin price $1
Source: X

This crucial level could trigger major selling pressures for the meme coin as investors start liquidating their holdings. However, if Dogecoin can successfully break above the $0.44 level, the meme coin could enter a bullish phase, with its next price high at around $0.56. 

Trading Jesus has highlighted the $0.56 price increase as a profit-taking level at which traders and investors could begin selling their Dogecoin for potential gains. The analyst has also pinpointed a higher resistance level at $0.73336 if Dogecoin can maintain its bullish momentum above that level. 

At the $0.73336 resistance level, Trading Jesus has predicted that Dogecoin could see its price surging to the highly coveted $1 milestone. His chart revealed Dogecoin’s next bullish target to be $0.996 if its price continues increasing. 

On the flip side, Trading Jesus has also shown the support levels for Dogecoin if it fails to break past key resistance levels. The first support at $0.34 represents a crucial level where buyers might step in if the price of Dogecoin drops. This support level ultimately acts as a barrier to prevent more price drops.

If Dogecoin declines below the $0.34 support level, the cryptocurrency could experience further downward pressure, leading to a drop towards the $0.25 mark. If more pullbacks occur, Trading Jesus has revealed that the Dogecoin price could bottom to new lows around the $0.18 level. 

Analyst Remains Bullish Despite DOGE’s 8% Price Decline

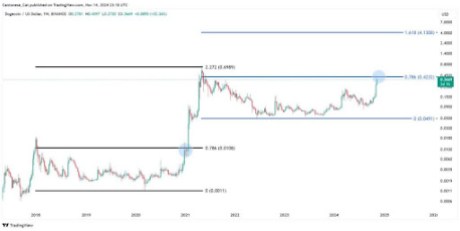
While analysts foresee the Dogecoin price hitting $1, others have predicted even higher all-time highs for the popular meme coin. A crypto analyst known as the ‘Cantonese Cat’ on X has unveiled a weekly DOGE price chart projecting a potential leap to $4. 

Related Reading
Dogecoin price $1 2
Source: X

In the chart, the analyst indicated that Dogecoin is on its way to hitting the $0.42 price level at the 0.786 Fibonacci level. Breaking past this level could trigger a surge towards the 1.618 Fib, representing a price increase above $4.0.

The Cantonese cat has revealed that investors and traders likely have three to four weeks to accumulate at Dogecoin’s current price of $0.36 before it shoots up to $4. 

Dogecoin price chart from Tradingview.com
DOGE price looking at reversal | Source: DOGEUSDT on Tradingview.com

Featured image created with Dall.E, chart from Tradingview.com

Why Memecoin Frenzy Is Bad For Bitcoin

Este artículo también está disponible en español.

Data shows Dogecoin and other meme coins are receiving a significant amount of attention on social media, a sign that may not be ideal for Bitcoin.

Top 6 Memecoins Have Seen Their Social Dominance Rocket Up Recently

In a new post on X, the analytics firm Santiment has discussed about the trend in the Social Dominance for a few different subsections of the cryptocurrency sector.

The “Social Dominance” here refers to an indicator that basically tells us about the mindshare that a particular asset or a group of coins has on the major social media platforms right now.

Related Reading

More formally, the metric’s value is calculated as a percentage of the discussions related to the top 100 cryptocurrencies by market cap that the given asset is making up for.

To determine this, the indicator collects posts/threads/messages available on five platforms: X, Reddit, Telegram, 4Chan, and BitcoinTalk. It then filters them for the keyword in question.

Note that for measuring the “discussion,” the metric simply counts up these posts containing at least one mention of the asset, rather than counting up the mentions themselves. The advantage of this methodology is that outlier posts containing hundreds of mentions don’t skew the data.

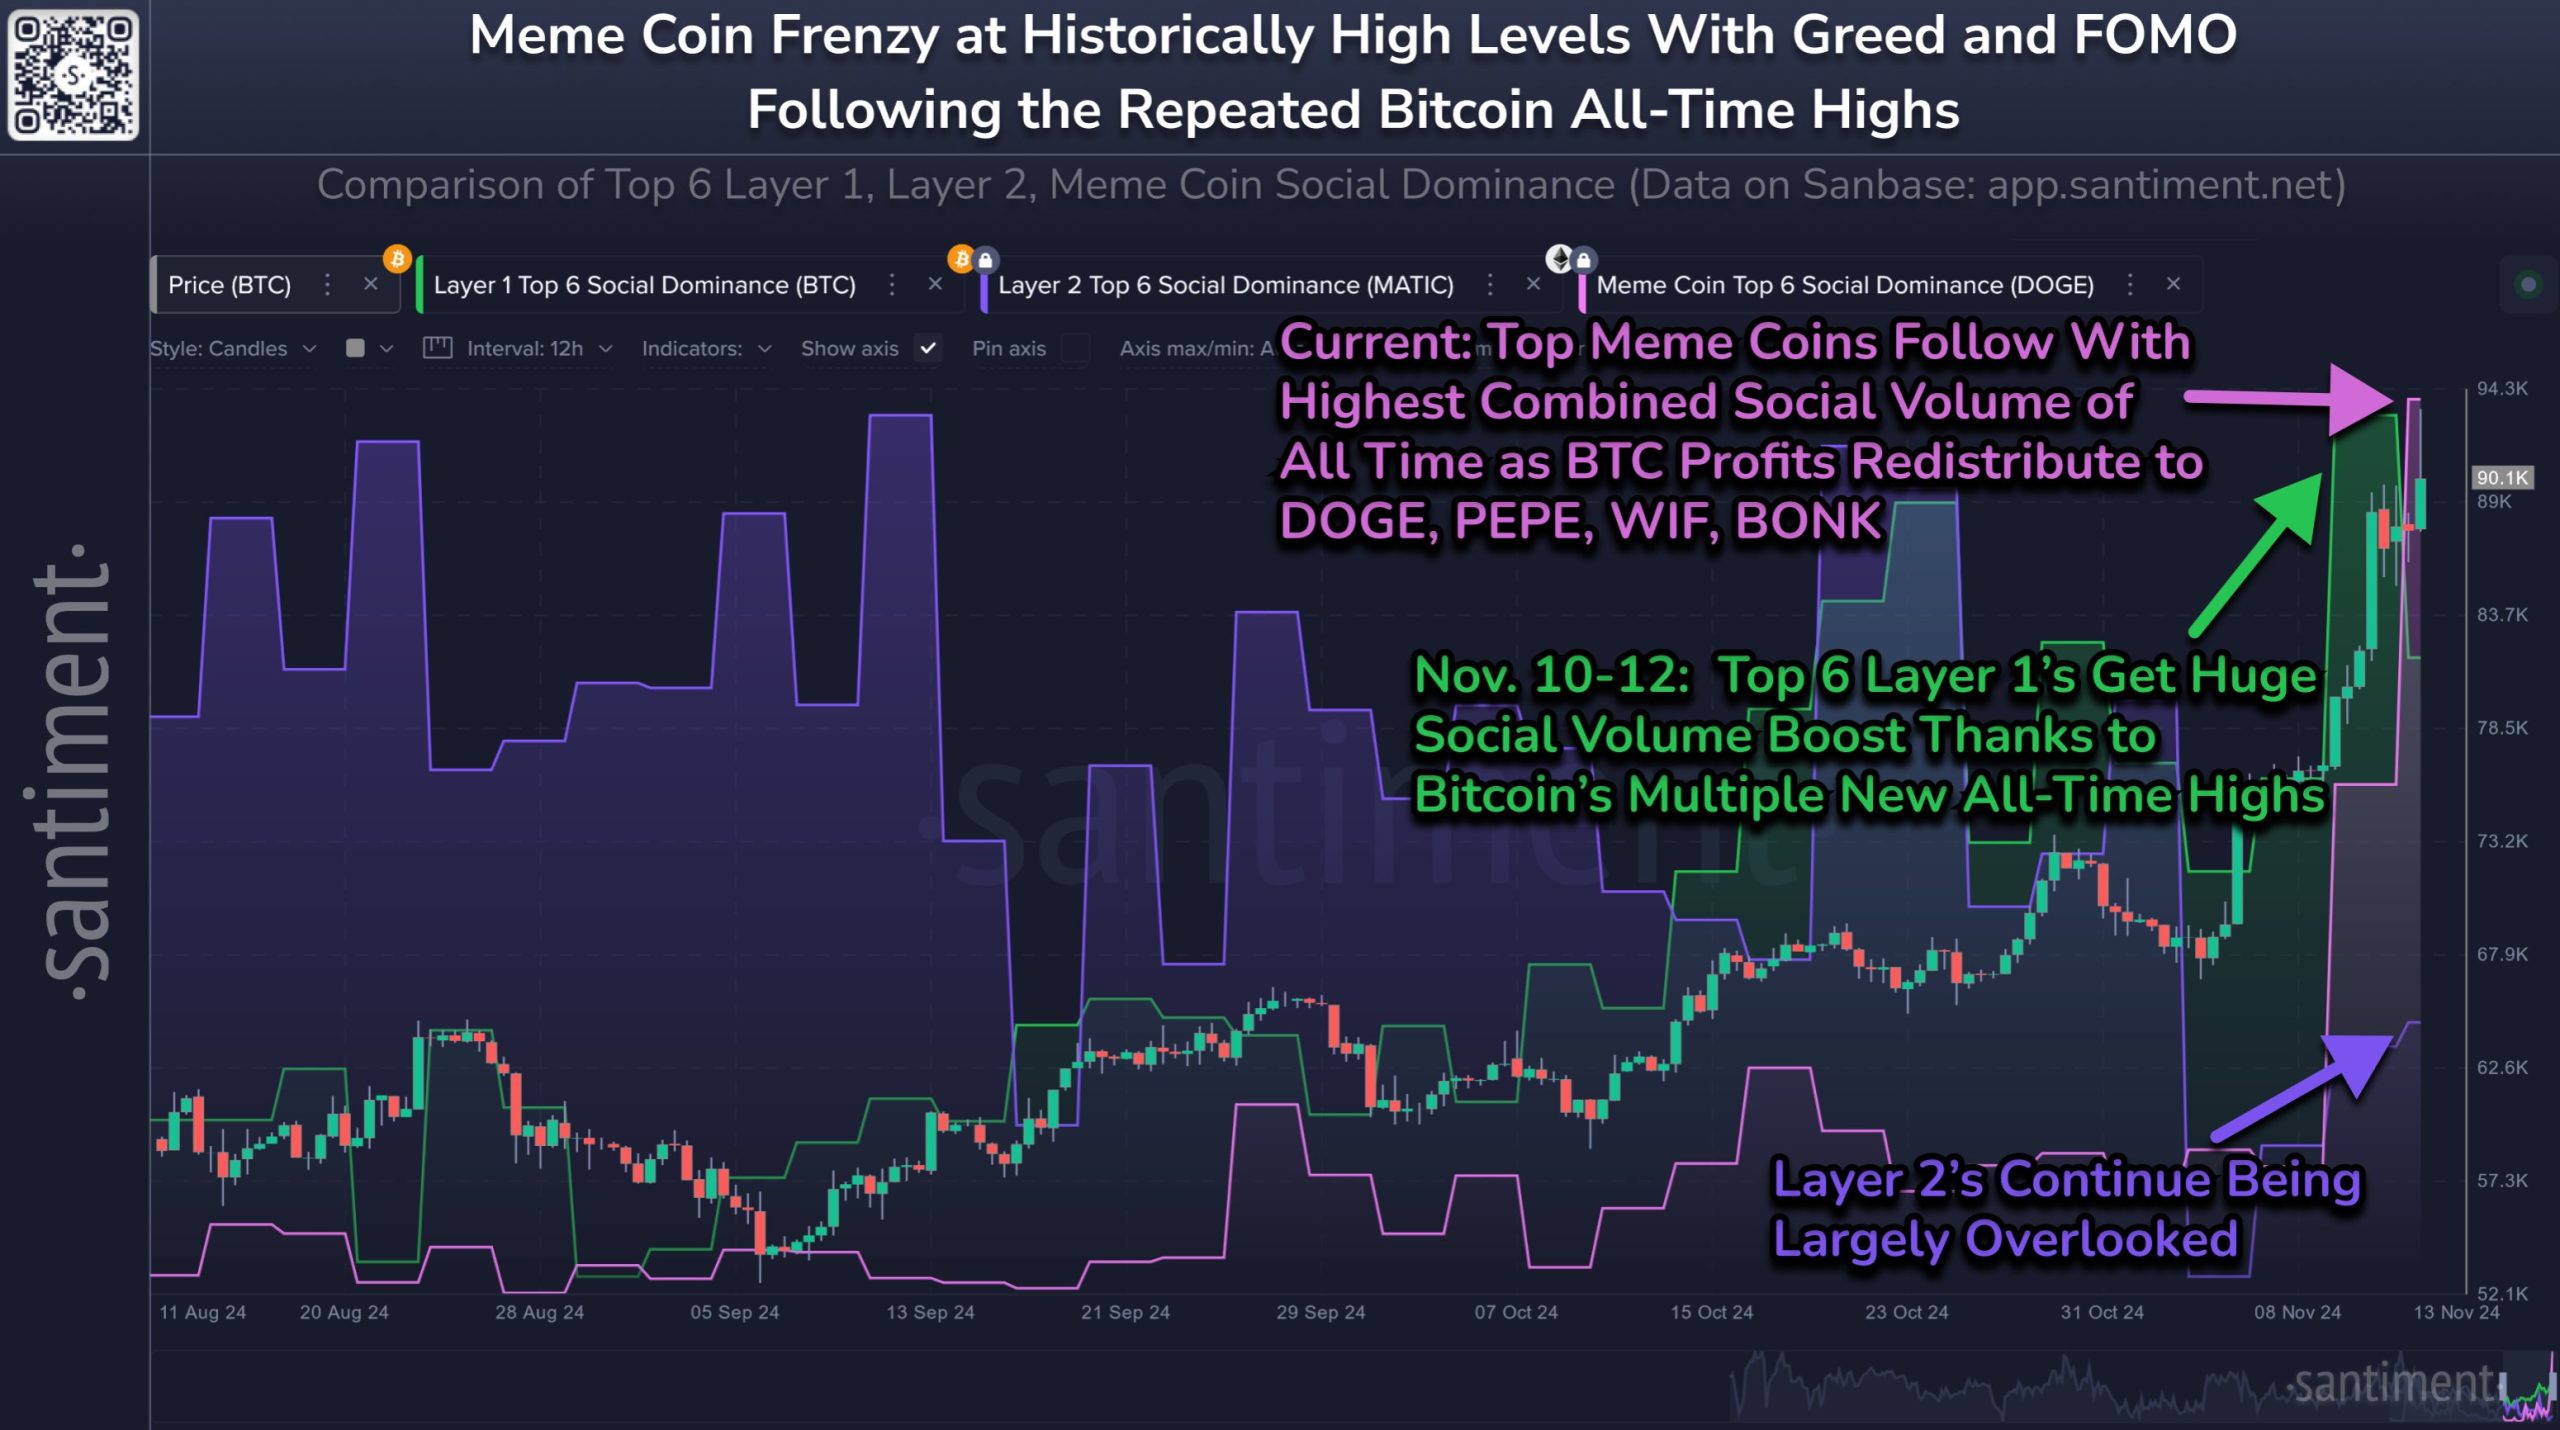
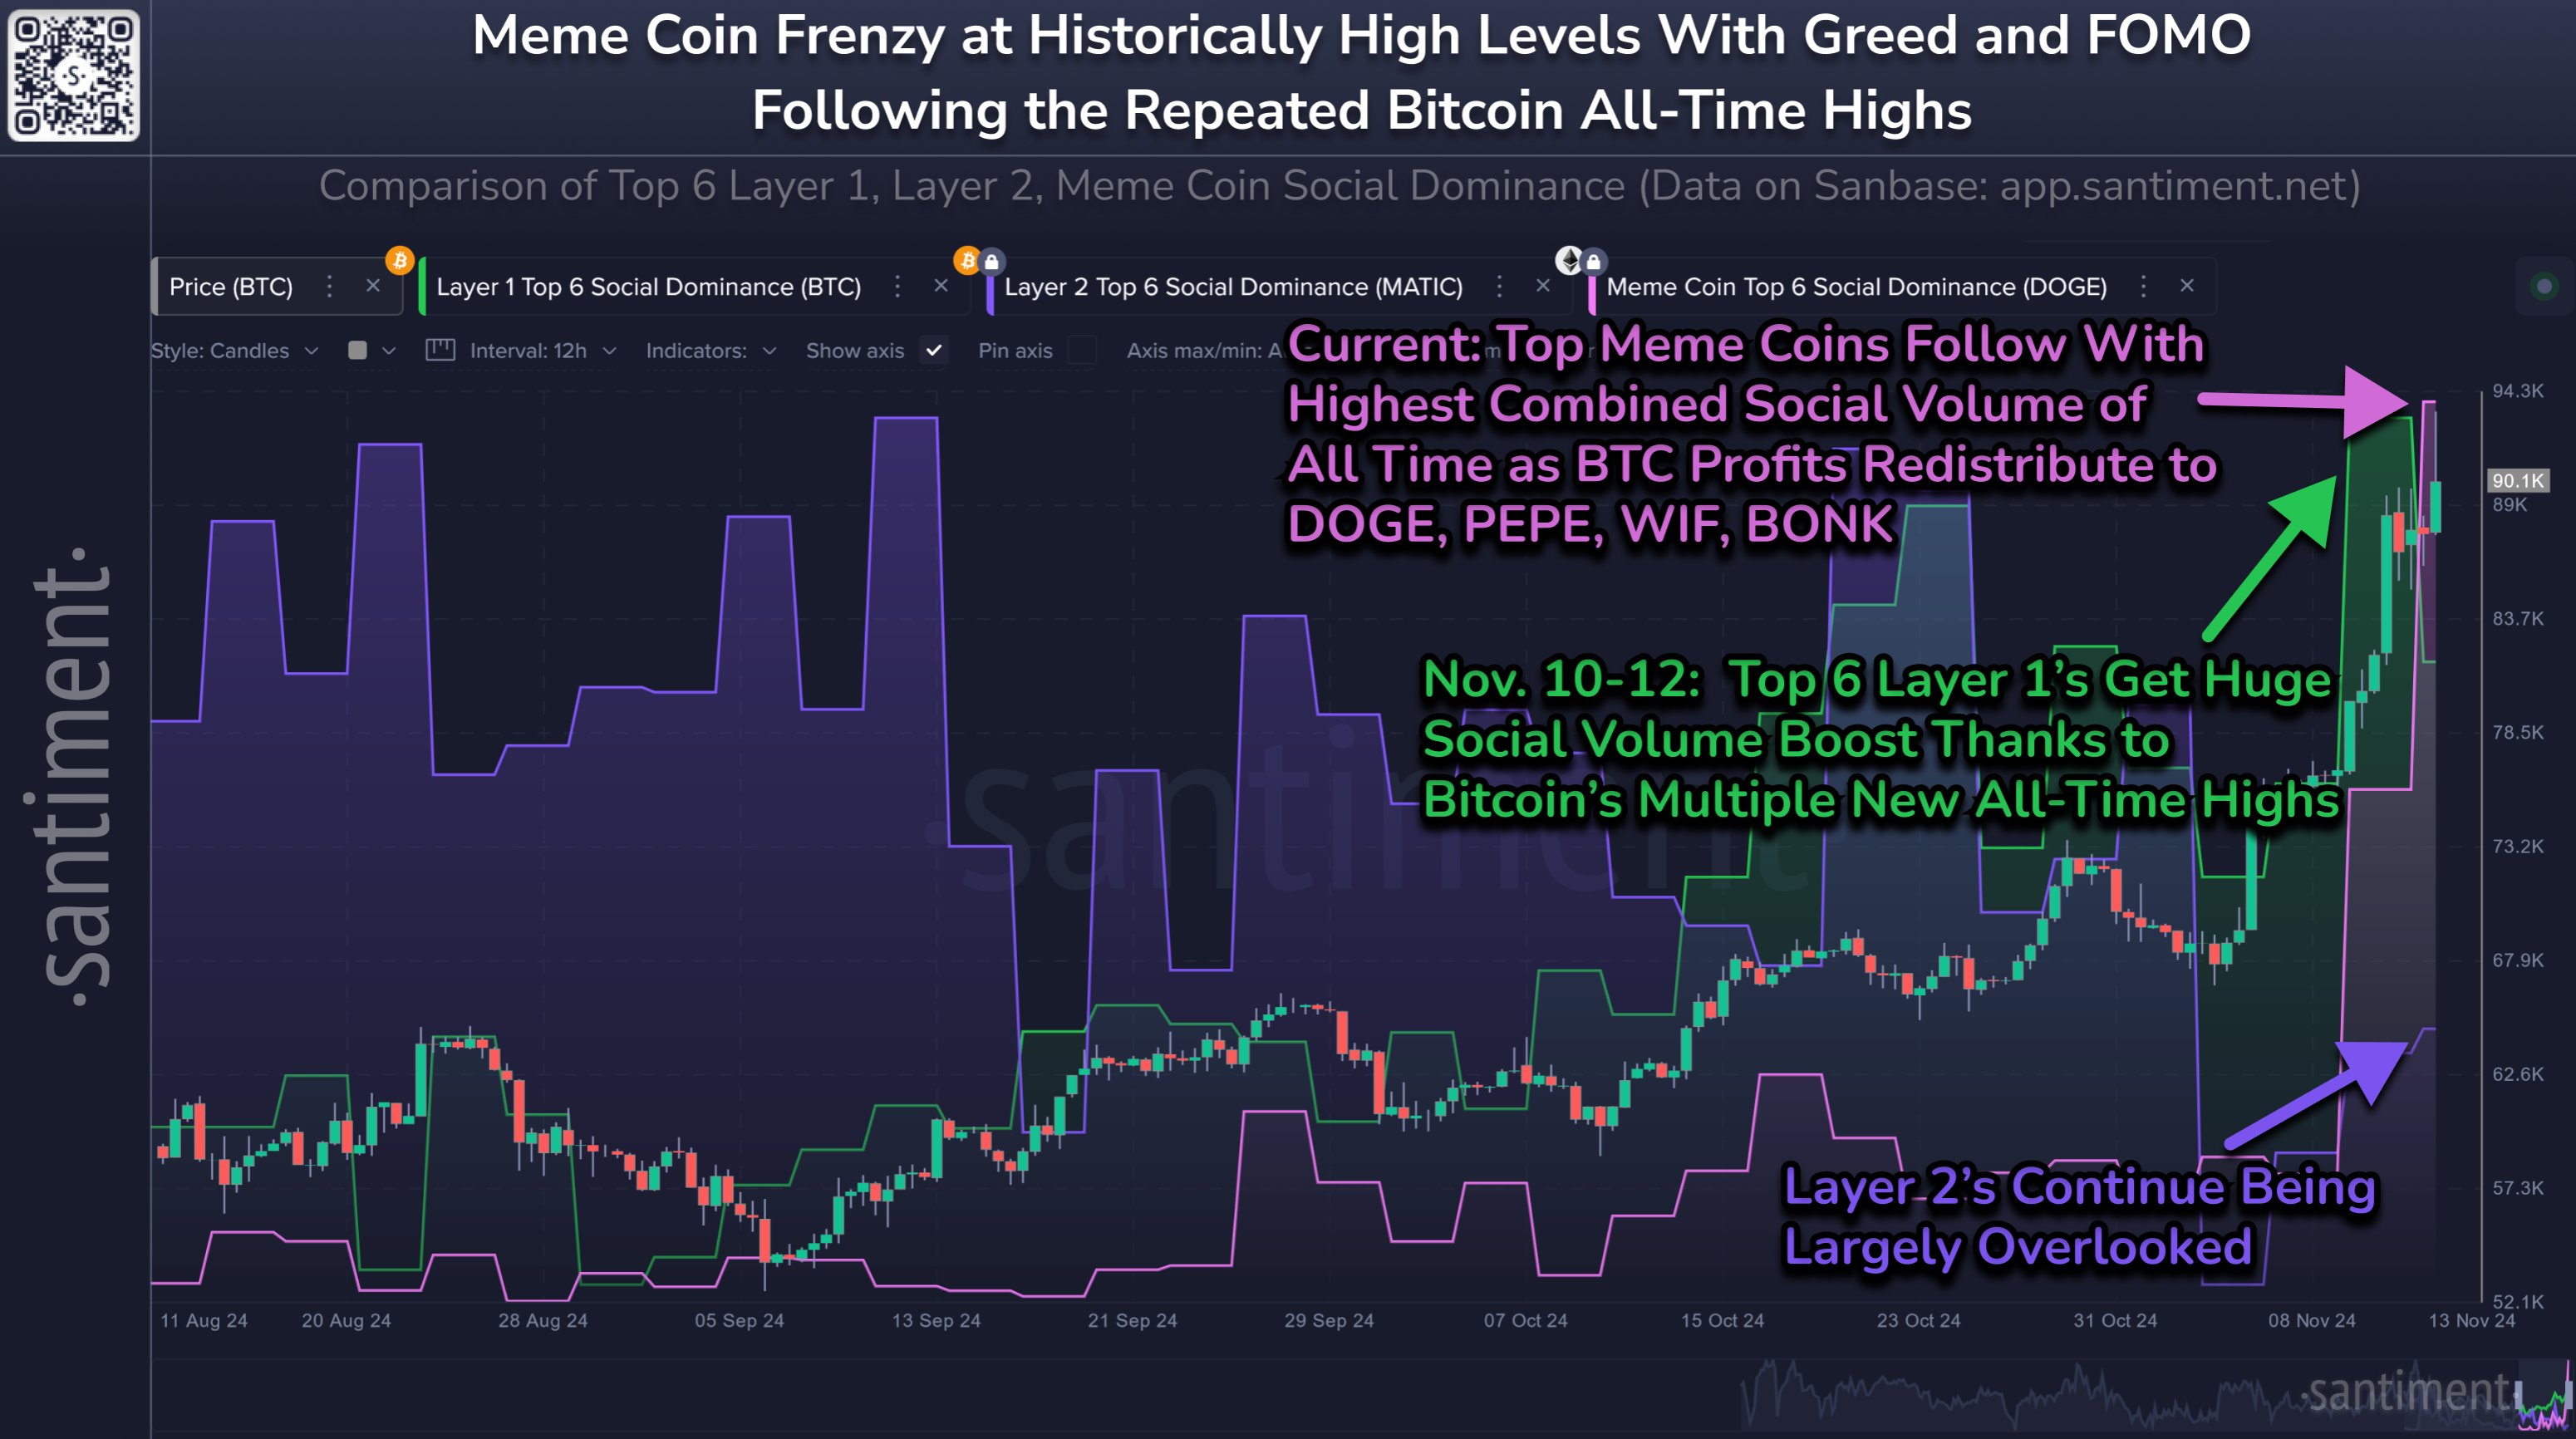
Now, here is the chart shared by the analytics firm that shows how the Social Dominance related to three subsections of the market has changed over the last few months:

Dogecoin vs Bitcoin Social Dominance
The value of the metric appears to have surged for Dogecoin and other meme coins recently | Source: Santiment on X

The three segments in question are the layer 1 top six, the layer 2 top six, and the memecoin top 6. “Layer 1” networks refer to the primary blockchains that handle their own security, like Bitcoin and Ethereum. Networks like Polygon that are built on top of these chains are known as “layer 2.” Naturally, the meme coins refer to the popular meme-based tokens, like Dogecoin and Shiba Inu.

From the graph, it’s apparent that the Social Dominance of the layer 1 top 6 had rocketed up a couple of days back as a result of Bitcoin setting multiple new all-time highs (ATHs).

BTC has continued to explore new highs since then, but it appears that the focus of social media users has shifted elsewhere, with the Social Dominance of the layer 1 giants witnessing a cooldown.

The indicator has stayed relatively low for the layer 2 coins throughout this, implying the traders haven’t been caring much about them recently. The assets that have hogged all the attention have been the memecoins, who have just seen their discussion hit a new record.

The reason behind this high interest in these tokens is the impressive rally that Dogecoin has seen over the past week, leaving the rest of the sector in the dust after amassing profits of more than 104%. If the past is anything to go by, though, this outperformance may not be such a good thing.

“Historically high speculative asset social dominance typically indicates greed and emotional trading,” notes Santiment. Assets in the cryptocurrency sector tend to move opposite to the crowd’s beliefs, so greed is something that has generally led to tops for the market.

Related Reading

As such, it’s possible that a shift in focus away from Dogecoin may have to happen, if Bitcoin and others have to continue their bull run.

Dogecoin Price

At the time of writing, Dogecoin is trading around $0.398, up over 2% in the last 24 hours.

Dogecoin Price Chart
The price of the coin appears to have slowed down over the last couple of days | Source: DOGEUSDT on TradingView

Featured image from Dall-E, Santiment.net, chart from TradingView.com

Bitcoin Price Holds The Line: Is Another Surge Possible?

Este artículo también está disponible en español.

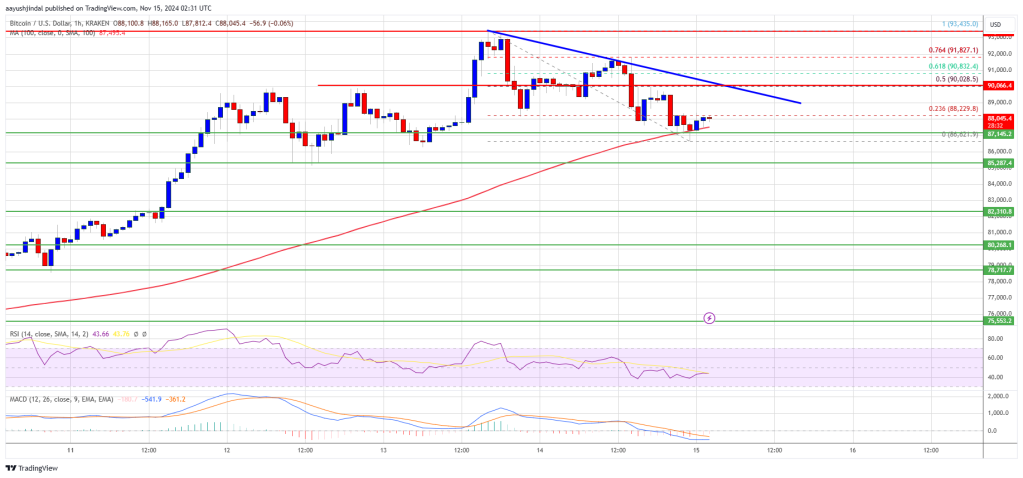
Bitcoin price saw a short-term correction from the $93,450 zone. BTC is now consolidating gains near $87,000 and might attempt another increase in the near term.

  • Bitcoin started a downside correction from the $93,450 zone.
  • The price is trading above $87,000 and the 100 hourly Simple moving average.
  • There is a connecting bearish trend line forming with resistance at $90,000 on the hourly chart of the BTC/USD pair (data feed from Kraken).
  • The pair could start a fresh increase if it stays above the $87,000 zone.

Bitcoin Price Starts Downside Correction

Bitcoin price attempted more gains above the $93,000 level. BTC traded to a new all-time high at $93,435 and recently started a short-term downside correction.

There was a minor decline below the $90,000 level. The price even dipped below the $88,000 level. A low was formed at $86,621 and the price is now consolidating. It is slowly moving higher and trading near the 23.6% Fib retracement level of the downward move from the $93,435 swing high to the $86,621 low.

Bitcoin price is now trading above $87,000 and the 100 hourly Simple moving average. On the upside, the price could face resistance near the $90,000 level. There is also a connecting bearish trend line forming with resistance at $90,000 on the hourly chart of the BTC/USD pair.

The trend line is close to the 50% Fib retracement level of the downward move from the $93,435 swing high to the $86,621 low. The first key resistance is near the $90,850 level. A clear move above the $90,850 resistance might send the price higher.

Bitcoin Price
Source: BTCUSD on TradingView.com

The next key resistance could be $91,500. A close above the $91,500 resistance might initiate more gains. In the stated case, the price could rise and test the $93,450 resistance level. Any more gains might send the price toward the $95,000 resistance level.

More Downsides In BTC?

If Bitcoin fails to rise above the $90,000 resistance zone, it could start a downside correction. Immediate support on the downside is near the $87,150 level.

The first major support is near the $86,500 level. The next support is now near the $85,280 zone. Any more losses might send the price toward the $82,500 support in the near term.

Technical indicators:

Hourly MACD – The MACD is now losing pace in the bearish zone.

Hourly RSI (Relative Strength Index) – The RSI for BTC/USD is now below the 80 level.

Major Support Levels – $87,150, followed by $86,500.

Major Resistance Levels – $90,000, and $91,500.

‘Kimchi Premium’ Returns Amid Rally

Rubmar is a writer and translator who has been a crypto enthusiast for the past four years. Her goal as a writer is to create informative, complete, and easily understandable pieces accessible to those entering the crypto space. After learning about cryptocurrencies in 2019, Rubmar became curious about the world of possibilities the industry offered, quickly learning that financial freedom was at the palm of her hand with the developing technology.

From a young age, Rubmar was curious about how languages work, finding special interest in wordplay and the peculiarities of dialects. Her curiosity grew as she became an avid reader in her teenage years. She explored freedom and new words through her favorite books, which shaped her view of the world. Rubmar acquired the necessary skills for in-depth research and analytical thinking at university, where she studied Literature and Linguistics. Her studies have given her a sharp perspective on several topics and allowed her to turn every stone in her investigations.

In 2019, she first dipped her toes in the crypto industry when a friend introduced her to Bitcoin and cryptocurrencies, but it wasn’t until 2020 that she started to dive into the depth of the industry. As Rubmar began to understand the mechanics of the crypto sphere, she saw a new world yet to be explored.

At the beginning of her crypto voyage, she discovered a new system that allowed her to have control over her finances. As a young adult of the 21st century, Rubmar has faced the challenges of the traditional banking system and the restrictions of fiat money.

After the failure of her home country’s economy, the limitations of traditional finances became clear. The bureaucratic, outdated structure made her feel hopeless and powerless amid an aggressive and distorted system created by hyperinflation. However, learning about decentralization and self-custody opened a realm of opportunities. Cryptocurrencies allowed her to experience financial control for the first time and expand her financial education.

Moreover, the peculiar nature of the crypto community sparked Rubmar’s curiosity about the other layers of the industry. As a result, she found a particular interest in discovering the diverse perspectives of investors, market watchers, experts, and developers. Her attempts to better understand the crypto space made her realize the strong links of the community with other industries, enriching her perspective of the sector. As someone who spends most of her day online, Rubmar enjoys finding the points where the crypto world meets with her other passions and hobbies ­–or her favorite memes.

In her free time, she usually finds joy in different art forms. As a child, she enlisted in every extra-curricular activity in her hometown, including music classes, dancing, jewelry making, and the local chorus. Despite her many attempts to learn different instruments, Rubmar only knows how to play the xylophone, which she played for 7 years in her school’s marching band.

She also has a passion for learning new languages and cultures, having set the goal to learn another six languages ­– currently attempting to learn Italian and Korean. Scrapbooking, paper crafting, and bookbinding are her biggest interests outside of work, constantly taking classes and attending workshops to learn new techniques. The rest of her free time is spent stressing over football matches and transfer market news or feeding cats –hers or stray.

In summary, Rubmar seeks to present entertaining and educational pieces to be enjoyed by everybody, aiming to report on the latest news and offer a unique perspective while adding a meme or a pun whenever possible.

Analysts Say It’s Behaving ‘As Predicted’

Este artículo también está disponible en español.

Crypto analysts said that Bitcoin remains on course for a massive price hike after Donald Trump reclaimed the US presidency through a historic win against US Vice President Kamala Harris.

Related Reading

Bitcoin’s price trajectory has been the subject of many speculations in the last few weeks but with the election of a known pro-crypto candidate, it seems BTC is moving in the upward direction.

At the time of writing, BItcoin was trading at $76,033, up 1.7% and 9.5% in the daily and weekly timeframes, data from Coingecko shows. The figure marks bitcoin new all-time high.

Bitcoin: $85,000 Feasible?

A prominent crypto analyst suggested that Bitcoin will soon reach $85,000, claiming that the price surge will be fueled by Trump’s return to the White House.

In a post, Ali Martinez said that the firstborn cryptocurrency is “playing as predicted.” Martinez predicted that Bitcoin would hit $78,000 but would fall to $71,500 before soaring to an all-time high of $85,000.

Martinez assured that despite the coin experiencing brief pullbacks, BTC’s price trajectory remains on track, noting the coin’s price stabilized at $74,812 after reaching an all-time record of $76,493.

In an earlier post, Martinez has already stated that Bitcoin is “going according to plan.” He said that BTC will increase to $72,000, and then go down to $69,000 before skyrocketing to $78,000.

BTC’s Uptrend

Another market observer predicted that there is a high likelihood that Bitcoin will increase by 30% to 40% but he does not see that the crypto will repeat the 368% hike which occurred in previous cycles.

BTCUSD trading at $75,885 on the daily chart: TradingView.com

Ki Young Ju of CryptoQuant made the prediction after BTC hit $75,000 which he believed was influenced greatly by the results of the US election.

Ju explained that it triggered the price rally to reach that level, further positioning Bitcoin as one of the largest financial assets in terms of market capitalization.

Ju urged investors for subtle profit-taking during the “max pain” phases which are essential to understand the market dynamics of BTC.

He said that Bitcoin follows a cyclical nature, explaining that new traders usually endure losses when the market is bearish. After two years, investors see their digital assets change hands when the “max pain” phase dies down.

According to him, BTC’s current market environment matched well with an easing period.

Related Reading

Potential Cooling Off

However, some analysts projected a possible cooling off for BTC coming after the recent price hike, saying that it has breached the upper Bollinger Band serving as a cue for overbought conditions.

They suggested that there could be increasing pressure to sell and profit-taking because of the emergence of red candlestick formations.

BTC used to be in the overbought zone or a score above 70 in the Relative Strength Index (RSI) chart but now, it has retreated to 67.34, indicating “a loss of bullish momentum” and a potential price correction.

Featured image from StormGain, chart from TradingView


Ethereum Price Rise Targets $3,000: Will It Cross the Mark?

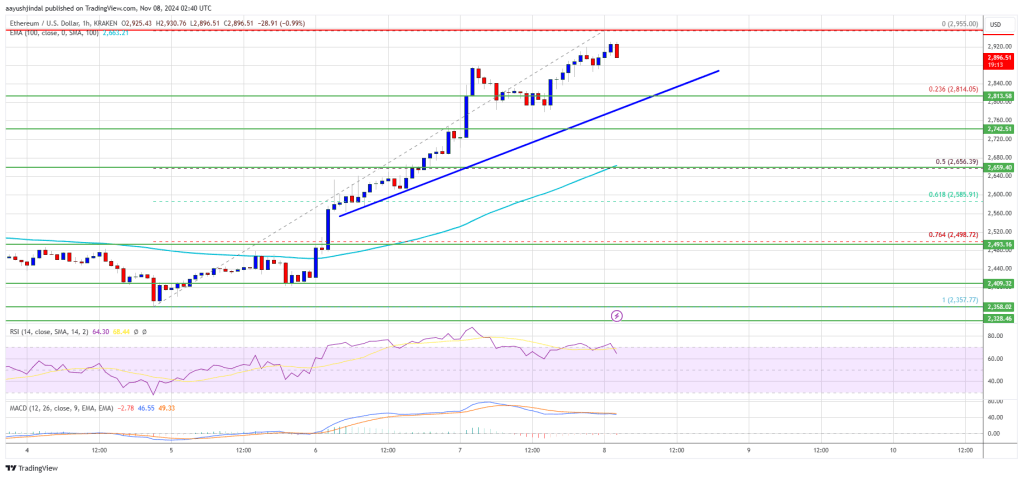
Ethereum price started a fresh increase above the $2,720 resistance. ETH is up over 10% and now approaches the key barrier at $3,000.

  • Ethereum started a fresh surge above the $2,720 resistance zone.
  • The price is trading above $2,750 and the 100-hourly Simple Moving Average.
  • There is a new connecting bullish trend line forming with support at $2,820 on the hourly chart of ETH/USD (data feed via Kraken).
  • The pair could continue to rise if it clears the $2,950 resistance.

Ethereum Price Extends Its Increase

Ethereum price started a fresh increase above the $2,650 resistance like Bitcoin. ETH was able to climb above the $2,720 and $2,750 resistance levels to move further into a positive zone.

It even surged above the $2,850 level in the past few sessions, beating BTC. It is up over 10% and there was a move above $2,920. A high is formed at $2,955 and the price is showing signs of more upsides. It is well above the 23.6% Fib retracement level of the upward move from the $2,355 swing low to the $2,955 high.

Ethereum price is now trading above $2,800 and the 100-hourly Simple Moving Average. There is also a connecting bullish trend line forming with support at $2,820 on the hourly chart of ETH/USD.

On the upside, the price seems to be facing hurdles near the $2,920 level. The first major resistance is near the $2,950 level. The main resistance is now forming near $3,000. A clear move above the $3,000 resistance might send the price toward the $3,120 resistance.

Ethereum Price

An upside break above the $3,120 resistance might call for more gains in the coming sessions. In the stated case, Ether could rise toward the $3,250 resistance zone.

Are Dips Limited In ETH?

If Ethereum fails to clear the $2,950 resistance, it could start a downside correction. Initial support on the downside is near the $2,850 level. The first major support sits near the $2,820 zone and the trend line.

A clear move below the $2,820 support might push the price toward $2,720. Any more losses might send the price toward the $2,650 support level in the near term. The next key support sits at $2,550.

Technical Indicators

Hourly MACDThe MACD for ETH/USD is gaining momentum in the bullish zone.

Hourly RSIThe RSI for ETH/USD is now above the 50 zone.

Major Support Level – $2,820

Major Resistance Level – $2,950

Analyst Predicts ‘The Final Ascent’ For Bitcoin Price, Why A Rise To $300,000 Is Possible From Here

Este artículo también está disponible en español.

The Bitcoin price has now returned into a full bullish sentiment now that the crypto fear and greed index has flipped into greed. This shift reflects growing confidence among investors as optimism takes hold in the cryptocurrency market. For many investors, this renewed positive outlook serves as a strong foundation for more gains in the Bitcoin price.

According to a crypto analyst, Bitcoin is ripe for a final ascent to the $300,000 price level. Interestingly, this outlook is not just based on the current bullish sentiment, but the analyst is going off of technical analysis of the current Bitcoin price action.

Final Ascent For Bitcoin Price

Crypto analyst Gert van Lagen took to social media platform X to share an intriguing outlook concerning Bitcoin and its price action this year in light of the recent US presidential elections and its effect of its price. Speaking of an intriguing outlook for the Bitcoin price, analyst van Lagen highlighted that Bitcoin is still on track to reach $250,000 this year. 

Related Reading

His outlook came through a funny poem and a play of words on the Bitcoin price action from August, which he titled “#Bitcoin – The Final Ascent.” The analyst also shared a BTC price chart with technical analysis. 

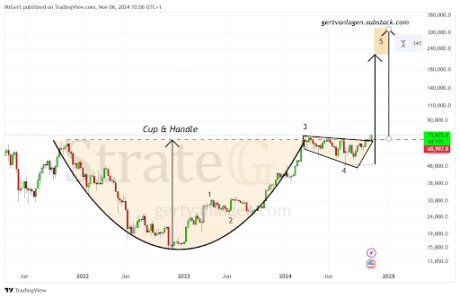
Central to van Lagen’s analysis is a detailed look at the cup and handle pattern that has been developing in Bitcoin’s price chart since the 2022 bear market. According to his analysis, the ‘cup’ portion of this pattern began forming in early 2022 and eventually concluded with Bitcoin’s surge past its previous 2021 all-time high in March 2024. The subsequent consolidation phase, which lasted until October, represents the ‘handle’ segment of the pattern.

With recent inflows driving Bitcoin to fresh all-time highs, the price has now broken out from the neck of long-standing cup and handle formation, marking the beginning of what van Lagen dubs ‘the final ascent.’ 

Bitcoin price
Source: X

What’s Next For Bitcoin?

The cup and handle pattern is often seen as a bullish continuation signal. Breakouts from this pattern often indicate that the asset is about to experience a massive upward movement.

Related Reading

In the case of the Bitcoin price and its breakout from the cup and handle pattern, Gert van Lagen highlighted a surge to the $300,000 price level. Notably, this outlook is also based on the prediction of a recession in the next six months.

“A warning sign we can’t abide.  For history shows in months but six, Recession strikes—the clock now ticks,” he said.

In terms of a projected timeline, van Lagen expects the Bitcoin price to reach $250,000 and subsequently $300,000 latest by February 25. 

At the time of writing, Bitcoin is trading at $74,845. A surge towards $250,000 and $300,000 will represent 235% and 300% increase, respectively, from the current price level.

Bitcoin price chart from Tradingview.com
BTC price shooting for $75,000 | Source: BTCUSD on Tradingview.com

Featured image created with Dall.E, chart from Tradingview.com
XRP Price Ready to Rally? Signs Point to a Bullish Move

Aayush Jindal, a luminary in the world of financial markets, whose expertise spans over 15 illustrious years in the realms of Forex and cryptocurrency trading. Renowned for his unparalleled proficiency in providing technical analysis, Aayush is a trusted advisor and senior market expert to investors worldwide, guiding them through the intricate landscapes of modern finance with his keen insights and astute chart analysis.

From a young age, Aayush exhibited a natural aptitude for deciphering complex systems and unraveling patterns. Fueled by an insatiable curiosity for understanding market dynamics, he embarked on a journey that would lead him to become one of the foremost authorities in the fields of Forex and crypto trading. With a meticulous eye for detail and an unwavering commitment to excellence, Aayush honed his craft over the years, mastering the art of technical analysis and chart interpretation.
As a software engineer, Aayush harnesses the power of technology to optimize trading strategies and develop innovative solutions for navigating the volatile waters of financial markets. His background in software engineering has equipped him with a unique skill set, enabling him to leverage cutting-edge tools and algorithms to gain a competitive edge in an ever-evolving landscape.

In addition to his roles in finance and technology, Aayush serves as the director of a prestigious IT company, where he spearheads initiatives aimed at driving digital innovation and transformation. Under his visionary leadership, the company has flourished, cementing its position as a leader in the tech industry and paving the way for groundbreaking advancements in software development and IT solutions.

Despite his demanding professional commitments, Aayush is a firm believer in the importance of work-life balance. An avid traveler and adventurer, he finds solace in exploring new destinations, immersing himself in different cultures, and forging lasting memories along the way. Whether he’s trekking through the Himalayas, diving in the azure waters of the Maldives, or experiencing the vibrant energy of bustling metropolises, Aayush embraces every opportunity to broaden his horizons and create unforgettable experiences.

Aayush’s journey to success is marked by a relentless pursuit of excellence and a steadfast commitment to continuous learning and growth. His academic achievements are a testament to his dedication and passion for excellence, having completed his software engineering with honors and excelling in every department.

At his core, Aayush is driven by a profound passion for analyzing markets and uncovering profitable opportunities amidst volatility. Whether he’s poring over price charts, identifying key support and resistance levels, or providing insightful analysis to his clients and followers, Aayush’s unwavering dedication to his craft sets him apart as a true industry leader and a beacon of inspiration to aspiring traders around the globe.

In a world where uncertainty reigns supreme, Aayush Jindal stands as a guiding light, illuminating the path to financial success with his unparalleled expertise, unwavering integrity, and boundless enthusiasm for the markets.

Analyst Says This Is What You Should Expect Next

Este artículo también está disponible en español.

The Bitcoin price hit a new all-time high (ATH) as it surged past $73,700 and rose to as high as $75,000 on November 6. Following this development, crypto analyst Tony Severino has revealed what to expect next from the flagship crypto. 

Bitcoin Price Ready For “Fireworks” After New ATH

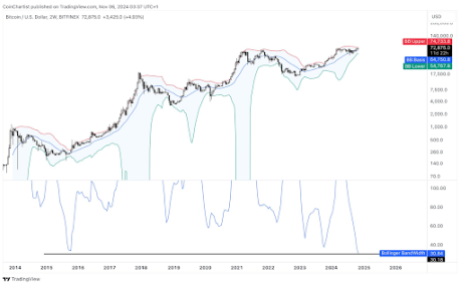
In an X post, Tony Severino indicated that the Bitcoin price is ready to experience a parabolic rally, as he told market participants to expect fireworks above $75,000. The crypto analyst also revealed that Bitcoin was approaching the 2-week upper Bollinger Band while the bands are the tightest in history according to the BBWidth. 

Related Reading

Bitcoin price
Source: X

The accompanying chart, which the crypto analyst shared, showed that the Bitcoin price could rise to as high as $140,000, with the flagship crypto reaching a potential market top in 2025. Tony Severino had previously mentioned that Bitcoin was approaching the strongest part of the bull run and explained how, based on historical trends, BTC could rise to as high as $133,000. 

Indeed, the Bitcoin price looks to be entering the strongest part of the bull run following its rise to a new all-time high. This recent price rally to a new ATH is thanks to Donald Trump, who has been elected to become the next US president. This provides a bullish outlook for Bitcoin and the broader crypto market since the US president-elect has publicly declared his support for Bitcoin and other cryptocurrencies. 

Besides Trump coasting to victory, it is worth mentioning that the Bitcoin price has historically never been below the levels it was at on US presidential election days. Therefore, this is likely the lowest range the flagship crypto might trade at before it records the next parabolic leg of this bull run. 

A Fed Rate Cut Is Also On The Way

In addition to Donald Trump’s victory, some other catalysts are lined up to spark the next leg of the Bitcoin bull run. One is a possible Fed rate cut that is expected to come on November 7, which is bullish for the Bitcoin price. The US Federal Reserve begins its FOMC meeting today and will decide on a rate cut by tomorrow. 

Related Reading

CME Fedwatch data shows a 97.6% chance the Fed will cut interest rates by 25 basis points (bps). This provides a bullish outlook for the Bitcoin price as more capital is set to flow into its ecosystem. Institutional investors are also on the sidelines as they will likely invest more money in the Spot Bitcoin ETFs after the US elections and a Fed rate cut. 

At the time of writing, the Bitcoin price is trading at around $74,500, up over 9% in the last 24 hours, according to data from CoinMarketCap. 

Bitcoin price chart from Tradingview.com
BTC price reaches new ATH | Source: BTCUSD on Tradingview.com

Featured image created with Dall.E, chart from Tradingview.com
Is a Bigger Rally on The Way?

Este artículo también está disponible en español.

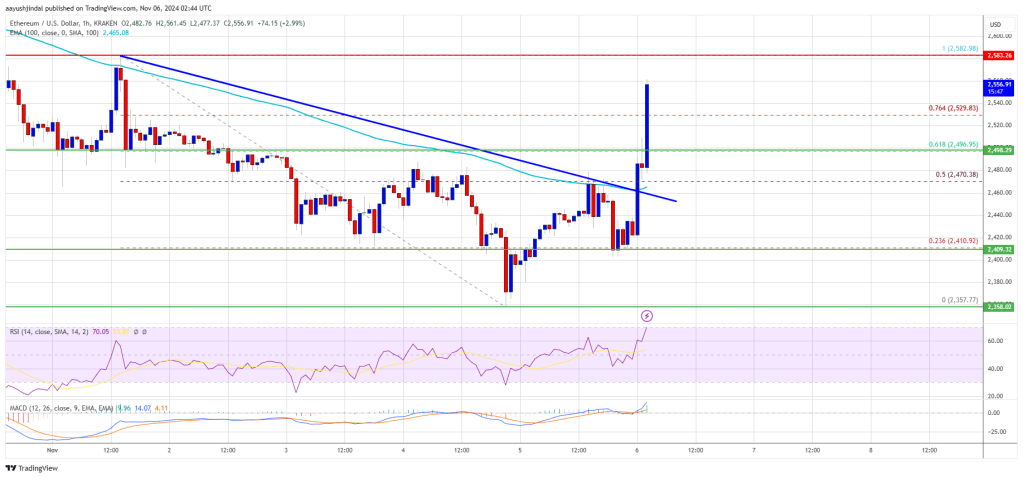
Ethereum price found support near $2,350 and started a fresh increase. ETH is rising and might aim for a move above the $2,580 resistance.

  • Ethereum started a fresh surge above the $2,500 resistance zone.
  • The price is trading above $2,500 and the 100-hourly Simple Moving Average.
  • There was a break above a key bearish trend line with resistance at $2,460 on the hourly chart of ETH/USD (data feed via Kraken).
  • The pair could gain bullish momentum if it settles above $2,580 and $2,620.

Ethereum Price Restarts Increase

Ethereum price found support near $2,350 and started a fresh increase like Bitcoin. ETH was able to climb above the $2,420 and $2,450 resistance levels to move into a positive zone.

It cleared the 50% Fib retracement level of the downward move from the $2,583 swing high to the $2,357 low. Besides, there was a break above a key bearish trend line with resistance at $2,460 on the hourly chart of ETH/USD.

Ethereum price is now trading above $2,500 and the 100-hourly Simple Moving Average. It is also above the 76.4% Fib retracement level of the downward move from the $2,583 swing high to the $2,357 low.

On the upside, the price seems to be facing hurdles near the $2,580 level. The first major resistance is near the $2,620 level. The main resistance is now forming near $2,650. A clear move above the $2,650 resistance might send the price toward the $2,720 resistance.

Ethereum Price
Source: ETHUSD on TradingView.com

An upside break above the $2,720 resistance might call for more gains in the coming sessions. In the stated case, Ether could rise toward the $2,750 resistance zone.

Another Drop In ETH?

If Ethereum fails to clear the $2,620 resistance, it could start another decline. Initial support on the downside is near the $2,520 level. The first major support sits near the $2,500 zone.

A clear move below the $2,500 support might push the price toward $2,450. Any more losses might send the price toward the $2,320 support level in the near term. The next key support sits at $2,350.

Technical Indicators

Hourly MACDThe MACD for ETH/USD is gaining momentum in the bullish zone.

Hourly RSIThe RSI for ETH/USD is now above the 50 zone.

Major Support Level – $2,450

Major Resistance Level – $2,620