Author: ADM

Bitcoin Price Fails At MA-200, Is A Crash To $52,000 Coming?

Este artículo también está disponible en español.

Following its brief stint above $66,000, the Bitcoin price fall had put it below multiple important levels. This allowed the bears to thrive as they reclaimed control of the largest cryptocurrency by market cap once again. Even now, as the Bitcoin price looks toward some recovery, the bear camp continue to wax stronger, with a most recent failure to break the MA-200, suggesting that the uptrend may only be temporary and a larger crash could be at play.

Why The Bitcoin Price Failing At MA-200 Is Bad

Crypto analyst RLinda revealed in a TradingView post that the Bitcoin price had actually tried to break the M1-200 level. This attempt took place on the daily chart with the price moving toward the $64,000-$65,000 resistance. However, the resistance at $64,000 proved too strong and the Bitcoin price was beaten down once again.

Related Reading

The product of this failure at the daily MA-200 now is that the Bitcoin price is now forming a descending channel. Naturally, this is bearish for the Bitcoin price given that descending channels are often messengers of a crash. Add in the fact that the price has broken a range boundary with a strong liquidity zone formed and the crypto analyst believes that the market could be headed further down.

Since the bears remain in control, it seems to be a matter of when, not if, the Bitcoin price will retrace again. After this, the question of how low the price can go swims to the fore and the crypto analyst is currently looking at an at least 10% fall, which would push the price out of $60,000 again.

The main resistance levels presented by the crypto analyst are $62,745 and $64,955. This means that this are the levels the Bitcoin price must successfully scale in order to confirm the uptrend. In comparison, RLinda puts support levels at $60,000, $59,250, and $57,700. If the BTC price is unable to sustain these levels, then the dip could be deeper than expected, possibly crashing as low as $52,000.

How To Weaken The Bearish Pressure

Another analyst who has highlighted the Bitcoin price failure to break the MA-200 is Alan Santana. He explains in his post that the fact that the cryptocurrency is now trading below this MA-200 has strengthened the bearish bias with a drop expected to follow.

Related Reading

However, there are a couple of developments that could help to weaken the mounting bearish pressure. The first of these is if the Bitcoin price were able to close above $66,500 on the weekly chart. The second is if BTC is able to complete a monthly close above $71,000.

Both of these scenarios would work to invalidate the bearish pressure that is currently mounting on the Bitcoin price. “As long as Bitcoin trades below 66,500 (short-term) or below 71,000 (long-term), the bearish bias remains intact,” the crypto analyst warned.

Bitcoin price chart from Tradingview.com
BTC price falls toward $61,000 | Source: BTCUSD on Tradingview.com

Featured image created with Dall.E, chart from Tradingview.com

Standard Chartered Analysts Says Ethereum Price Will Reach $10,000 If This Happens

Este artículo también está disponible en español.

Analysts at British multinational bank, Standard Chartered have predicted that the price of Ethereum (ETH) could potentially climb to $10,000 in response to the anticipated political changes set to take place following the upcoming United States (US) Presidential elections.

Standard Chartered Predicts Ethereum To $10,000

In a research note by the head of Standard Chartered crypto research, Geoffrey Kendrick, Ethereum could experience a dramatic rise to $10,000 if Donald Trump, the former US President wins the upcoming election. 

Related Reading

Delving into the potential impact of a Trump administration on the future of the digital asset industry, Kendrick predicts that both Ethereum and Solana (SOL) will outperform Bitcoin (BTC) significantly, reaching new all-time highs. The report posits that changes in a country’s political regime tend to have a significant influence on the trajectory of leading digital assets over time. 

Based on this observation, Kendrick expects Solana to significantly outperform Ethereum under a Trump regime. While Ethereum will witness significant growth and possibly maintain its rank as the top altcoin with the largest market capitalization, a Trump win could change the market dynamics, potentially triggering even higher gains and adoption for its competitor, Solana. 

On a different note, if the current US Vice President, Kamala Harris wins the upcoming elections, Kendrick’s report projects that Ethereum could surge to $7,000, marking a 30% or $3,000 drop from the projected $10,000 target under a Trump administration. However, under Harris’s leadership, Ethereum will solidify its position as the leading altcoin, potentially outperforming Bitcoin and Solana in gains.  

It’s important to note that Standard Chartered has cut down its earlier forecast for Ethereum by nearly 50%, underscoring the volatility and unpredictability of the market. In an earlier report, the multinational bank had predicted that Ethereum could reach $14,000 by 2025, driven by the approval of Spot Ethereum ETFs

Although Spot Ethereum ETFs have gained said approval and are now trading, Ethereum’s price remains significantly below $3,000. Nevertheless, the results of the US Presidential elections scheduled for November 5, could have a more bullish impact on Ethereum, potentially triggering a massive run to new highs. 

ETH Faces Drop To $1,600 If Key Support Fails

While market experts deliver optimistic projections for Ethereum’s price, a prominent crypto analyst, Ali Martinez has taken a more bearish stance, predicting a significant decline for this altcoin if it fails to hold a crucial support level

Related Reading

In an X (formerly Twitter) post on Monday, Martinez disclosed that if Ethereum can stay above the $2,300 support threshold, its price could breakout to new all-time highs of $6,000. On the other hand, if the top altcoin fails to maintain this level, it could trigger a massive drop to the next support at $1,600. 

As of writing, the price of Ethereum is trading at $2,432, and a decrease to $1,600 would represent a massive 34.21% plunge for the cryptocurrency.  

Ethereum price chart from Tradingview.com
ETH price struggles to hold up | Source: ETHUSDT on Tradingview.com

Featured image created with Dall.E, chart from Tradingview.com

Shiba Inu Earns Recognition For Charitable Contributions – Impact On Price

Shiba Inu (SHIB) was announced by a prominent crypto personality as the most donated meme coin as these type of coins continue to grow in importance for charitable causes. This kind of recognition shows how these digital assets can benefit communities and gain business traction.

Shiba Inu: On Praise & Performance

Meme coin projects have earned praise from Ethereum co-founder Vitalik Buterin for donating a percentage of their token supply to charity. He thanked the projects and efforts dedicated to this cause in a post on X. Some “meme coins” were used as examples, including “ebull,” among well-known cryptocurrencies contributing to various charities.

Support & Dedication

Based on comments made by Buterin, Shiba Inu community members have claimed that among meme coins, SHIB leads in charity gifts. According to crypto expert Del Crxpto, no other meme coin can even emulate Shiba Inu’s level of philanthropy. For example, several donations, including to the recent Seungil Hope Foundation in Seoul, Korea which supports the country’s first specialized ALS hospital, reflect this growing dedication to giving.

Analyst Sees SHIB Uptrend

In related news, with good breakout and backtest signs in the very vibrant meme coin space, technical analyst Charting Guy has predicted a possible price spike for Shiba Inu. The market of meme coin prospers today; some of them are reaching all-time highs, while others display solid price rise.

Meme Coin In Negative Region

Shiba Inu was up 3.34% at the time of writing, trading at $0.00001793, but the weekly performance remained in negative territory cumulatively.

Charting Guy thinks the dog-themed meme coin is likely to have a major price pump even if the price action has been disappointing lately. Shiba Inu is in the last waiting period, he pointed out, and expected to show a significant upside.

Featured image from United Mission for Relief & Development, chart from TradingView


Shiba Inu Price Set To Rally Over 2430% To $0.000047 As Trend Oscillator Turns Bullish

Este artículo también está disponible en español.

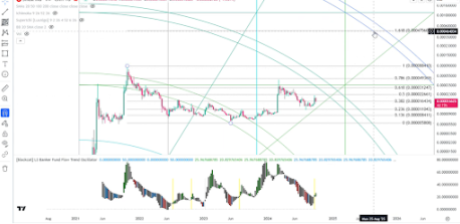
The price of Shiba Inu might be currently declining, but an analyst says the meme coin is gearing up for a bullish run as it is currently flashing a buy signal. According to Cantonese Cat, SHIB is now flashing a strong buy signal based on the L3 Banker Fund Flow Trend Oscillator, a relatively lesser-known indicator. 

In a detailed breakdown shared via a YouTube video, Cantonese Cat explored SHIB’s recent price action in conjunction with this oscillator, revealing that it is ready for at least a 5x move to its all-time high, up until a bigger 2430% increase to a target of $0.00047.

Shiba Inu Flashes Buy Signal

Cantonese Cat’s latest analysis on Shiba Inu offers an interesting angle to the meme coin’s price action alongside other altcoins. The video in which he shared his analysis covers the current SHIB movement in relation to the larger altcoin market. As such, the analyst notes that Shiba Inu is one of ten cryptocurrencies among Optimism, Avalanche, Cardano, Chainlink, Boba Network, COTI, Amp, Cartesi, and Injective, which are all flashing a buy signal with the L3 Banker Fund Flow Trend Oscillator. 

Related Reading

The L3 Banker Fund Flow Trend Oscillator is a technical indicator used to analyze the flow of capital in and out of cryptocurrencies among large market participants. A detailed analysis of SHIB’s price action with this indicator shows that this buy signal is extremely rare. The last time it flashed a buy signal for SHIB was in July 2023.

At that time, SHIB was trading below $0.000008. What’s more interesting is that even though the buy signal appeared then, SHIB’s price continued to consolidate for another six months before finally experiencing a strong rally in February 2024 during the broader crypto market upturn. Fast forward to October 2024, and SHIB is now showing another sign of a bullish rally with the L3 Banker Fund Flow Trend Oscillator.

SHIB Price Targets To Expect

Although the buy signal is derived from the banker fund oscillator, the analyst uses Fibonacci levels to predict potential targets when the breakout eventually occurs. The first target is the 1 Fibonacci extension level, which aligns with SHIB’s current all-time high of $0.0000884. He also noted an ultimate “crazy target” for those anticipating a bigger surge. This ultimate target is at the 1.618 Fibonacci extension level, which aligns with $0.00047. 

Related Reading

Shiba Inu price
Source: X

Reaching this price would require SHIB to break through multiple resistance levels, both before and after surpassing its all-time high. Achieving this “crazy target” would represent a 2,430% increase or approximately a 30x jump from the current price level. Cantonese Cat suggests that this target could be achieved by August or September 2025, although he admits this is a highly ambitious target. According to him, a more feasible target is a 10x run from the current SHIB price.

At the time of writing, SHIB is trading at $0.00001733 and is down by 6% in 24 hours. 

Shiba Inu price chart from Tradingview.com
SHIB price still holding up | Source: SHIBUSDT on Tradingview.com

Featured image created with Dall.E, chart from Tradingview.com

Solana (SOL) Flashes Breakdown Signs: Will Support Hold?

Aayush Jindal, a luminary in the world of financial markets, whose expertise spans over 15 illustrious years in the realms of Forex and cryptocurrency trading. Renowned for his unparalleled proficiency in providing technical analysis, Aayush is a trusted advisor and senior market expert to investors worldwide, guiding them through the intricate landscapes of modern finance with his keen insights and astute chart analysis.

From a young age, Aayush exhibited a natural aptitude for deciphering complex systems and unraveling patterns. Fueled by an insatiable curiosity for understanding market dynamics, he embarked on a journey that would lead him to become one of the foremost authorities in the fields of Forex and crypto trading. With a meticulous eye for detail and an unwavering commitment to excellence, Aayush honed his craft over the years, mastering the art of technical analysis and chart interpretation.
As a software engineer, Aayush harnesses the power of technology to optimize trading strategies and develop innovative solutions for navigating the volatile waters of financial markets. His background in software engineering has equipped him with a unique skill set, enabling him to leverage cutting-edge tools and algorithms to gain a competitive edge in an ever-evolving landscape.

In addition to his roles in finance and technology, Aayush serves as the director of a prestigious IT company, where he spearheads initiatives aimed at driving digital innovation and transformation. Under his visionary leadership, the company has flourished, cementing its position as a leader in the tech industry and paving the way for groundbreaking advancements in software development and IT solutions.

Despite his demanding professional commitments, Aayush is a firm believer in the importance of work-life balance. An avid traveler and adventurer, he finds solace in exploring new destinations, immersing himself in different cultures, and forging lasting memories along the way. Whether he’s trekking through the Himalayas, diving in the azure waters of the Maldives, or experiencing the vibrant energy of bustling metropolises, Aayush embraces every opportunity to broaden his horizons and create unforgettable experiences.

Aayush’s journey to success is marked by a relentless pursuit of excellence and a steadfast commitment to continuous learning and growth. His academic achievements are a testament to his dedication and passion for excellence, having completed his software engineering with honors and excelling in every department.

At his core, Aayush is driven by a profound passion for analyzing markets and uncovering profitable opportunities amidst volatility. Whether he’s poring over price charts, identifying key support and resistance levels, or providing insightful analysis to his clients and followers, Aayush’s unwavering dedication to his craft sets him apart as a true industry leader and a beacon of inspiration to aspiring traders around the globe.

In a world where uncertainty reigns supreme, Aayush Jindal stands as a guiding light, illuminating the path to financial success with his unparalleled expertise, unwavering integrity, and boundless enthusiasm for the markets.

Optimism, Aptos, And Taiko Face $169.66 Million In Token Unlocks, Should You Buy Or Sell?

Este artículo también está disponible en español.

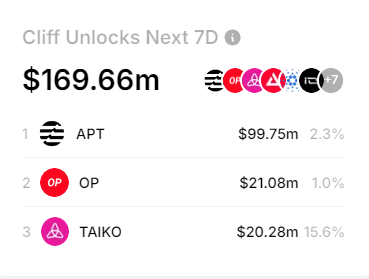
The cryptocurrency market is gearing up for a major event as Optimism (OP), Aptos (APT), and Taiko (TAIKO) prepare for token unlocks collectively valued at $169.66 million. According to data from TokenUnlocksApp, millions of dollars worth of cryptocurrencies will flood various ecosystems this week, which could further amplify the prevailing selling pressure. Of these cryptocurrencies, Aptos (APT) dominates the token unlocks, with almost $100 million worth of APT set to be unlocked in the next seven days.

Explaining The Token Unlocks

Token unlocks refer to the release of a predetermined number of tokens that were previously locked or vested during the cryptocurrency’s launch. When these tokens become available, they can be traded on the market, which often leads to increased liquidity. However, a potential downside is that a sudden surge in supply can lead to price volatility as recipients of unlocked tokens might decide to sell, causing downward pressure on prices. As such, new buyers are used as the exit liquidity for early investors, team members, or project developers who are given these unlocked tokens.

Related Reading

According to data from TokenUnlocksApp, this week’s crypto market activity will see a significant release of tokens across three major projects: Optimism (OP), Aptos (APT), and Taiko (TAIKO). These upcoming unlocks are particularly noteworthy because they follow a cliff unlock mechanism, where a large number of tokens are released in one go. Interestingly, these unlocks come just a week after SUI, another prominent blockchain project, unlocked 64.19 million tokens valued at approximately $106 million.

Among these three projects, Aptos stands out with the most significant unlock. A total of 11.3 million APT tokens, collectively worth approximately $99.75 million at the current price of APT, are set to be released. The second most notable unlock comes from Optimism, which will release 12.47 million OP tokens valued at around $21 million. Taiko, a project focusing on zk-Rollup technology for Ethereum scaling, will also unlock 12 million tokens with a total value estimated at $20.28 million.

Token unlocks
Source: Token Unlocks

What Next? Should You Buy Or Sell?

Cliff token unlocks have more profound effects on the price of cryptocurrencies than linear unlocks. Of the three ecosystems, Taiko’s unlock seems to be the most important, as a larger part of its circulating supply (15.62%) is going to be unlocked in a single event, which could dramatically influence its price action. In comparison, Aptos and Optimism will see smaller portions of their total circulating supply unlocked. Aptos is set to unlock 2.3% of its circulating supply, while Optimism will release 1% of its circulating supply.

Related Reading

Nonetheless, monitoring the unlocks is crucial for investors in the rest of the week. This is especially true for retail investors, as they could bear the risk of the liquidity as these tokens are unlocked. They could be used as exit liquidity once the owners of the unlocked tokens decide to sell or reduce their exposure.

Optimism price chart from Tradingview.com (Token unlocks)
Optimism price drops ahead of token unlocks | Source: OPUSDT on Tradingview.com

Featured image created with Dall.E, chart from Tradingview.com

XRP Price Eyes Breakout: Will It Recover Lost Ground?

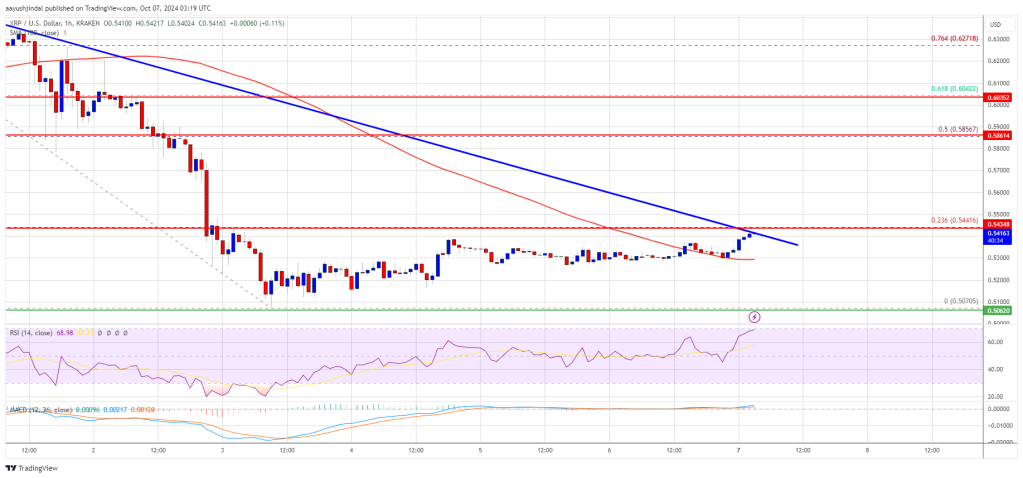
XRP price is consolidating above the $0.5080 support level. The price could gain pace if it clears the $0.5450 resistance zone in the near term.

  • XRP price is still consolidating above the $0.5080 support.
  • The price is now trading above $0.5250 and the 100-hourly Simple Moving Average.
  • There is a key bearish trend line forming with resistance at $0.5450 on the hourly chart of the XRP/USD pair (data source from Kraken).
  • The pair could gain bullish pace if it clears the $0.5450 and $0.5500 resistance levels.

XRP Price Eyes Recovery

XRP price extended its decline below the $0.5350 level, underperforming Bitcoin and Ethereum. The price even declined heavily below the $0.5250 support zone.

A low was formed at $0.5070 and the price is now consolidating losses. There was a minor move above the $0.5250 level. Recently, the price tested the 23.6% Fib retracement level of the downward wave from the $0.6640 swing high to the $0.5070 low.

The price is now trading above $0.5250 and the 100-hourly Simple Moving Average. On the upside, the price might face resistance near the $0.5450 level. There is also a key bearish trend line forming with resistance at $0.5450 on the hourly chart of the XRP/USD pair.

XRP Price

The first major resistance is near the $0.5500 level. The next key resistance could be $0.5650. A clear move above the $0.5650 resistance might send the price toward the $0.580 resistance. Any more gains might send the price toward the $0.6000 resistance or even $0.6050 in the near term.

Another Decline?

If XRP fails to clear the $0.5450 resistance zone, it could start another decline. Initial support on the downside is near the $0.5300 level. The next major support is near the $0.5250 level.

If there is a downside break and a close below the $0.5250 level, the price might continue to decline toward the $0.5120 support in the near term. The next major support sits near the $0.5080 zone.

Technical Indicators

Hourly MACD – The MACD for XRP/USD is now gaining pace in the bullish zone.

Hourly RSI (Relative Strength Index) – The RSI for XRP/USD is now above the 50 level.

Major Support Levels – $0.5250 and $0.5120.

Major Resistance Levels – $0.5450 and $0.5500.

Analyst Eyes $160 As Critical Breakpoint

Este artículo también está disponible en español.

Solana is testing a crucial level after weeks of volatile price action and market uncertainty. Following the Federal Reserve’s interest rate cut announcement, Solana surged 26% but quickly retraced 17%, reflecting the ongoing turbulence in the broader crypto market. This rollercoaster price movement has left many investors on edge as they wait for the next clear signal.

Related Reading

Amidst this uncertainty, top analysts are closely monitoring Solana’s next move, with one in particular pointing to the $160 mark as the decisive level that could determine its direction. A breakout above this level could reignite bullish momentum, while failure to do so may lead to further downside pressure.

The coming days will be critical for Solana as investors assess the market’s trajectory and brace for potential volatility. With SOL standing at a pivotal point, both bulls and bears are watching closely to see whether the price can break through key resistance or succumb to further correction.

Solana Testing Liquidity Below $160

Solana has experienced significant ups and downs over the past couple of weeks, leaving investors uncertain after the latest dip. Many were anticipating further gains before the retrace, which has now sparked caution in the market. With Solana trading in this volatile environment, the focus has shifted to key technical levels that could determine the next big move.

Top crypto analyst Daan has shared his insights on X, noting that Solana has formed three nearly equal highs around the $160 level. He also highlights that SOL is consistently making higher lows, a sign of potential bullish momentum building up.

Solana $160 key level to determine weekly price action.
Solana $160 key level to determine weekly price action. | Source: Daan on X

According to Daan, this gradual upward drift suggests that Solana could eventually break through the $160 resistance level, which would be a pivotal moment for the cryptocurrency.

Related Reading

The reaction at $160 will be crucial. If Solana manages to break above this level, it could signal a push to new highs and reignite bullish sentiment in the market. However, if the price fails to maintain momentum, Solana might remain range-bound between $120 and $160, continuing its sideways movement. Investors are closely watching these levels as Solana’s next direction could define its performance for the rest of the year.

Price Action: Supply Levels To Break

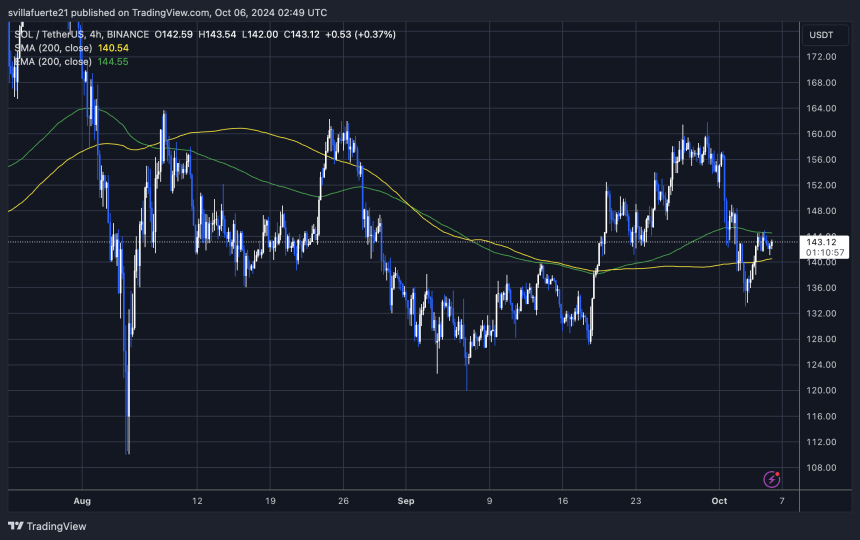
Solana (SOL) is currently trading at $143 after experiencing a few days of choppy price action. The market has been volatile, and SOL is now testing the critical 4-hour 200 exponential moving average (EMA) at $144.55. This level serves as a key resistance point, and a breakout above it could signal a bullish continuation for Solana.

SOL testing the 4H 200 EMA.
SOL is testing the 4H 200 EMA. | Source: SOLUSDT chart on TradingView

If SOL manages to break and hold above the 4-hour 200 EMA, the next target for bulls would likely be the $160 level. A move above $160 could reignite positive sentiment, potentially setting the stage for further gains. However, if SOL fails to break above the $144.55 resistance, a retrace to lower demand zones is expected.

Related Reading

In the event of rejection at the 4-hour 200 EMA, Solana could dip to the $127 support level, where traders and investors will closely monitor for signs of strength or further downside risk. The price action over the next few days will be crucial in determining whether SOL can resume its bullish trajectory or if a deeper retracement is on the horizon.

Featured image from Dall-E, chart from TradingView

Bitcoin Investors Show Fear, Could A Price Bottom Be Imminent?

Semilore Faleti is a cryptocurrency writer specialized in the field of journalism and content creation. While he started out writing on several subjects, Semilore soon found a knack for cracking down on the complexities and intricacies in the intriguing world of blockchains and cryptocurrency.

Semilore is drawn to the efficiency of digital assets in terms of storing, and transferring value. He is a staunch advocate for the adoption of cryptocurrency as he believes it can improve the digitalization and transparency of the existing financial systems.

In two years of active crypto writing, Semilore has covered multiple aspects of the digital asset space including blockchains, decentralized finance (DeFi), staking, non-fungible tokens (NFT), regulations and network upgrades among others.

In his early years, Semilore honed his skills as a content writer, curating educational articles that catered to a wide audience. His pieces were particularly valuable for individuals new to the crypto space, offering insightful explanations that demystified the world of digital currencies.

Semilore also curated pieces for veteran crypto users ensuring they were up to date with the latest blockchains, decentralized applications and network updates. This foundation in educational writing has continued to inform his work, ensuring that his current work remains accessible, accurate and informative.

Currently at NewsBTC, Semilore is dedicated to reporting the latest news on cryptocurrency price action, on-chain developments and whale activity. He also covers the latest token analysis and price predictions by top market experts thus providing readers with potentially insightful and actionable information.

Through his meticulous research and engaging writing style, Semilore strives to establish himself as a trusted source in the crypto journalism field to inform and educate his audience on the latest trends and developments in the rapidly evolving world of digital assets.

Outside his work, Semilore possesses other passions like all individuals. He is a big music fan with an interest in almost every genre. He can be described as a “music nomad” always ready to listen to new artists and explore new trends.

Semilore Faleti is also a strong advocate for social justice, preaching fairness, inclusivity, and equity. He actively promotes the engagement of issues centred around systemic inequalities and all forms of discrimination.

He also promotes political participation by all persons at all levels. He believes active contribution to governmental systems and policies is the fastest and most effective way to bring about permanent positive change in any society.

In conclusion, Semilore Faleti exemplifies the convergence of expertise, passion, and advocacy in the world of crypto journalism. He is a rare individual whose work in documenting the evolution of cryptocurrency will remain relevant for years to come.

His dedication to demystifying digital assets and advocating for their adoption, combined with his commitment to social justice and political engagement, positions him as a dynamic and influential voice in the industry.

Whether through his meticulous reporting at NewsBTC or his fervent promotion of fairness and equity, Semilore continues to inform, educate, and inspire his audience, striving for a more transparent and inclusive financial future.

Bitcoin Whales Set Profit-Taking Record In Bull Cycle — What’s Happening?

The price of Bitcoin has not had the most straightforward performance in 2024 despite a strong start to the year. The flagship cryptocurrency has spent most of the last two quarters in consolidation, fluctuating within the $50,000 and $70,000 range.

This uninspiring performance has sparked conversations about the current cycle, with several analysts and experts predicting whether the bull run is still on. Amongst the latest to comment is the CryptoQuant CEO, who offered an interesting on-chain insight into the cycle.

Why Are Whales Taking Less Profit This Cycle?

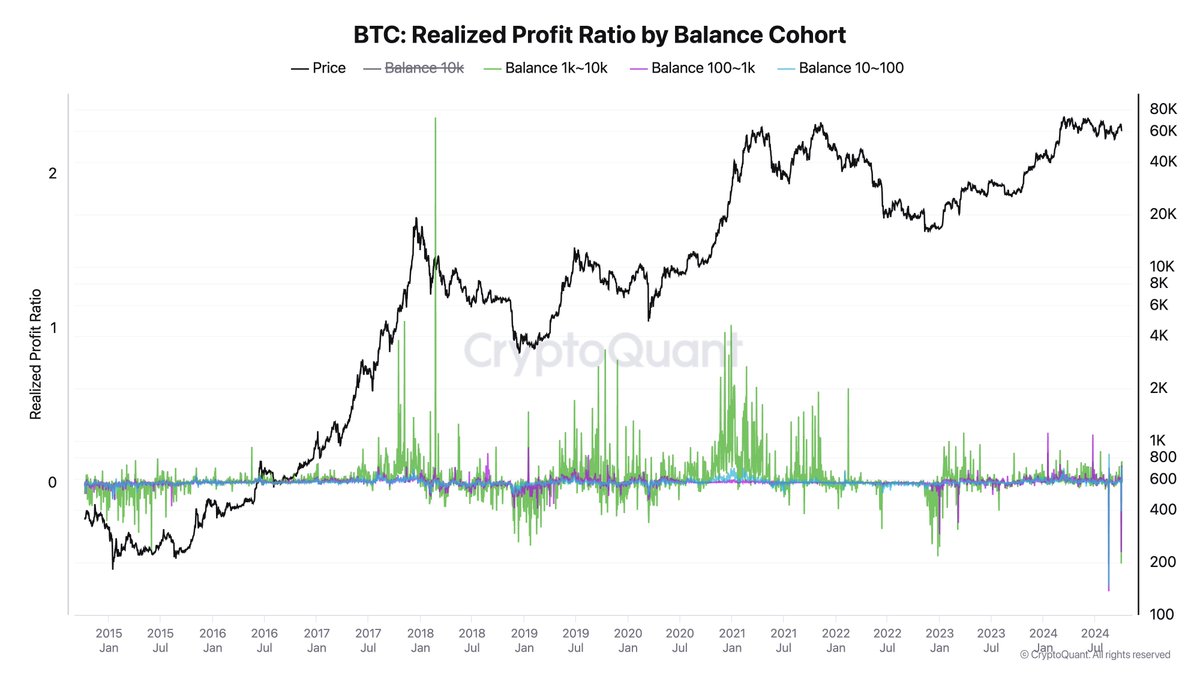
In a post on the X platform, CryptoQuant CEO Ki Young Ju revealed that the Bitcoin whales have held onto their assets this cycle. As a result, the large investors have set the record for the least profit-taking compared to other cycles if the current bull run ends now.

This on-chain revelation is based on the Realized Profit Ratio by Balance Cohort metric, which measures the ratio of coins sold at a profit by an investor class relative to the total coins sold at a given time. It basically evaluates the profitability of different cohorts of Bitcoin holders.

Bitcoin

Typically, when the Realized Profit Ratio of whales is high, it implies that a sell-off is likely ongoing, with the large investors believing that prices have peaked. On the other hand, a low Realized Profit Ratio often indicates a low level of profit-taking, meaning that investors are not cutting their losses or expecting further price gains.

The current on-chain data points to a trend where the large holders have taken the least amount of profits across any bull cycle. This could mean that the Bitcoin whales still have faith in Bitcoin’s long-term potential. Ultimately, this suggests that the current bull run is far from the end, and there is the possibility of the Bitcoin price uptrend resuming.

Bitcoin ‘Dolphin’ Addresses On The Rise Again: Santiment

In a post on X, Santiment revealed that the Bitcoin’s “Dolphin” cohort, holding between 0.1 to 10 BTC, have been growing steadily over the past few months. The analytics reported that this tier of investors mostly sold for profit in the first half of the year.

However, addresses holding between 0.1 and 10 BTC have been on the rise since early July. Specifically, the 0.1 – 1 BTC wallets have increased by 25,671 more addresses, while the 1 – 10 BTC wallets have climbed by about 4,000 addresses.

This indicates that small-scale investors might be returning to the market, which could be positive for the Bitcoin price over the coming months. As of this, the premier cryptocurrency is valued at $61,94, reflecting a 1.7% increase in the past day. 

Bitcoin