Category Archive : News

VanEck Sees Bitcoin As Key Global Reserve Asset, Projecting $3 Million Price Tag By 2050

Este artículo también está disponible en español.

As Bitcoin rebounds from its brief correction and approaches the $70,000 mark, Matthew Sigel, head of digital asset research at asset manager and crypto ETF issuer VanEck, shared his insights on the cryptocurrency’s potential trajectory in light of the upcoming US presidential election and broader economic factors in a recent CNBC interview.

Bitcoin Recovery Tied To M2 Growth And Seller Exhaustion

Sigel noted the correlation between former President Donald Trump’s lead in betting polls against Vice President Kamala Harris and Bitcoin’s rise. He characterized Trump as the most pro-crypto candidate, suggesting that his policies may favor the cryptocurrency market. 

Conversely, Sigel expressed skepticism about Harris’s understanding of Bitcoin, indicating that her administration may not prioritize cryptocurrency issues.

Related Reading

Delving deeper into Bitcoin’s price dynamics, Sigel highlighted several critical correlations. He pointed out a negative correlation with the US dollar and a positive correlation with the global money supply growth, known as M2, leading to the current uptrend. 

Sigel also attributed the recent price recovery to the Federal Reserve’s pivot towards reacceleration of M2 growth, alongside what he described as a current “seller exhaustion” in the BTC market.  

Additionally, Sigel identified a promising bullish setup for Bitcoin as the election approaches, particularly its rising correlation with the Nasdaq, reaching a two-year high of 1.5. 

Sigel recalled a similar pattern from the 2020 elections, where Bitcoin exhibited low volatility until the election outcome was announced, leading to a substantial rally as new buyers flooded the market. “New buyers are born every day,” he emphasized, indicating a steady influx of interest in Bitcoin.

When discussing Bitcoin’s relationship with gold and M2, Sigel described Bitcoin as a “chameleon,” highlighting its dynamic correlations that can shift over time. This variability makes it challenging to accurately predict Bitcoin’s short- and long-term behaviors.

$180,000 Post-Election, $3 Million By 2050

In addition to US political dynamics, Sigel pointed to recent activities within the BRICS intergovernmental organization, particularly the involvement of new members Argentina, the UAE, and Ethiopia in Bitcoin mining. 

The researcher noted that these countries are leveraging government resources to mine Bitcoin to counter what he termed the “irresponsible” fiscal policies of the US. 

Sigel also mentioned Russia’s plans for its sovereign wealth fund to invest in Bitcoin mining through BRICS, proposing settling global trade in Bitcoin.

Related Reading

When asked about potential future price points for BTC, Sigel explained that historical rallies have seen increases of around 2,000%. If Bitcoin were to achieve half of that rise post-election, it could reach approximately $180,000. 

Looking further ahead, Sigel referenced a model from VanEck’s digital asset research team, predicting that by 2050, Bitcoin could serve as a reserve asset for global trade, held by central banks at a rate of 2%. This model suggests a staggering $3 million per Bitcoin price by that year.

Bitcoin
The 1D chart shows that BTC’s price is trending upward. Source: BTCUSDT on TradingView.com

At the time of writing, BTC is trading at $68,900, up 1.7% over the past 24 hours. 

Featured image from DALL-E, chart from TradingView.com 

“Time To Get Ready For Another Bull Run,” Bitcoin Analyst Says— Here’s Why

An analyst has explained why it could be the time to get ready for a new Bitcoin bull run, based on the pattern developing in this on-chain metric.

Bitcoin US To The Rest Reserve Ratio Has Seen A Reversal Recently

In a CryptoQuant Quicktake post, an analyst discussed the recent trend in the BTC US to The Rest Reserve Ratio. This indicator tells us, as its name suggests, the ratio between the total Bitcoin reserves of the US-based centralized platforms and that of the global ones. Platforms here refer to not just the exchanges, but also other entities like banks and funds.

When the value of this metric is rising, it means the asset is currently moving from offshore platforms to American ones. Such a trend can be a sign of demand from the US-based investors. On the other hand, the indicator going down suggests the foreign platforms have higher demand for BTC right now as the American exchanges are losing dominance to them.

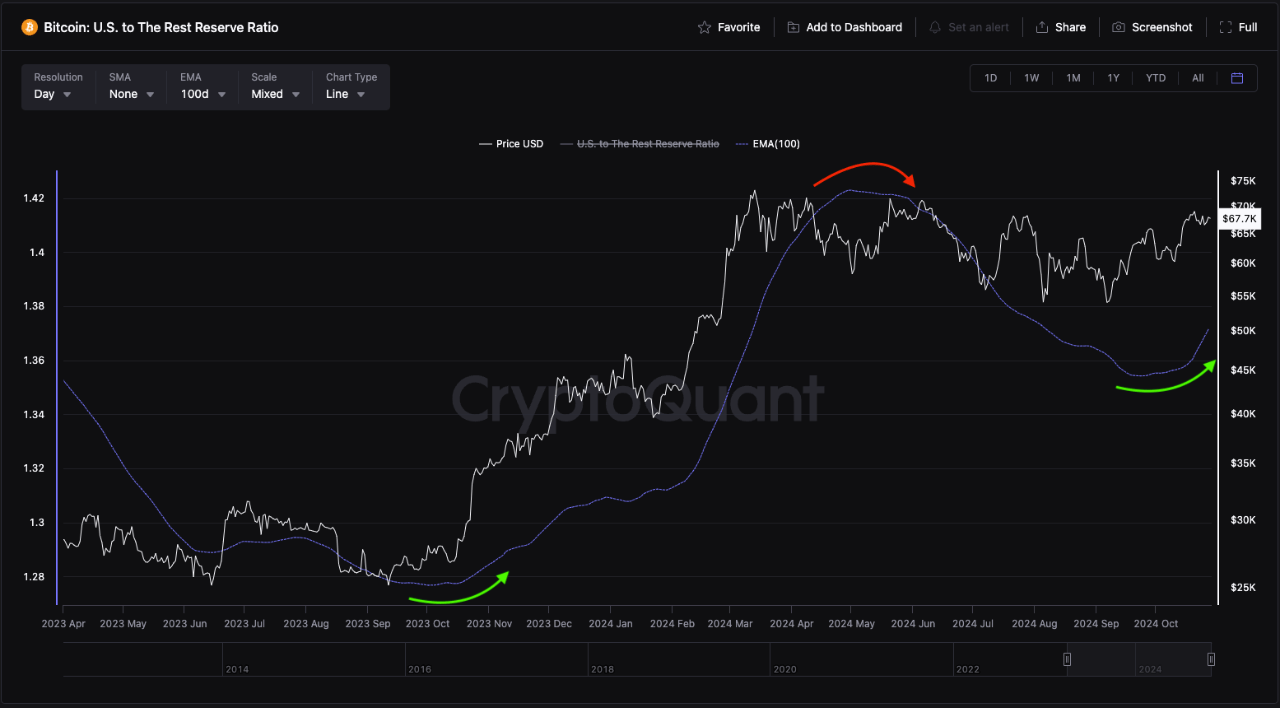
Now, here is a chart that shows the trend in the 100-day Exponential Moving Average (EMA) of the Bitcoin US to The Reserve Ratio over the past year and a half:

Bitcoin US To The Rest Reserve Ratio

As displayed in the above graph, the 100-day EMA Bitcoin US to The Rest Reserve Ratio had been declining earlier in the year, but during the past couple of months, its value has bottomed out and shown a reversal to the upside. This would mean that a transfer of BTC is now occurring from global platforms to the US-based ones. In the chart, the quant has marked the last instance of the indicator displaying this trend.

It would appear that the previous turnaround in the metric had occurred in the last quarter of 2023 and had accompanied a BTC rally that would eventually take the asset to a new all-time high (ATH). The sharpest part of this increase in the indicator had come in the first quarter of 2024. The reason behind this acceleration had been the introduction of the spot exchange-traded funds (ETFs) in the US, which had quickly gained popularity among the investors.

From the graph, it’s also visible, though, that a while after the price had reached the ATH, the metric had topped out and witnessed a reversal in direction. Thus, the spot ETFs couldn’t keep up the same level of interest.

The analyst notes that BTC’s sustained consolidation this year can be traced back to this decrease in the reserve of the US-based platforms. Since the indicator has once again shown a turnaround recently, it’s possible that Bitcoin could see the return of bullish momentum, if the previous pattern is to go by.

BTC Price

Following a 2% jump during the last 24 hours, Bitcoin has returned back to the $68,700 level.

Bitcoin Price Chart

XRP Price Holds Steady in Consolidation: Is a Shift Coming?

Aayush Jindal, a luminary in the world of financial markets, whose expertise spans over 15 illustrious years in the realms of Forex and cryptocurrency trading. Renowned for his unparalleled proficiency in providing technical analysis, Aayush is a trusted advisor and senior market expert to investors worldwide, guiding them through the intricate landscapes of modern finance with his keen insights and astute chart analysis.

From a young age, Aayush exhibited a natural aptitude for deciphering complex systems and unraveling patterns. Fueled by an insatiable curiosity for understanding market dynamics, he embarked on a journey that would lead him to become one of the foremost authorities in the fields of Forex and crypto trading. With a meticulous eye for detail and an unwavering commitment to excellence, Aayush honed his craft over the years, mastering the art of technical analysis and chart interpretation.
As a software engineer, Aayush harnesses the power of technology to optimize trading strategies and develop innovative solutions for navigating the volatile waters of financial markets. His background in software engineering has equipped him with a unique skill set, enabling him to leverage cutting-edge tools and algorithms to gain a competitive edge in an ever-evolving landscape.

In addition to his roles in finance and technology, Aayush serves as the director of a prestigious IT company, where he spearheads initiatives aimed at driving digital innovation and transformation. Under his visionary leadership, the company has flourished, cementing its position as a leader in the tech industry and paving the way for groundbreaking advancements in software development and IT solutions.

Despite his demanding professional commitments, Aayush is a firm believer in the importance of work-life balance. An avid traveler and adventurer, he finds solace in exploring new destinations, immersing himself in different cultures, and forging lasting memories along the way. Whether he’s trekking through the Himalayas, diving in the azure waters of the Maldives, or experiencing the vibrant energy of bustling metropolises, Aayush embraces every opportunity to broaden his horizons and create unforgettable experiences.

Aayush’s journey to success is marked by a relentless pursuit of excellence and a steadfast commitment to continuous learning and growth. His academic achievements are a testament to his dedication and passion for excellence, having completed his software engineering with honors and excelling in every department.

At his core, Aayush is driven by a profound passion for analyzing markets and uncovering profitable opportunities amidst volatility. Whether he’s poring over price charts, identifying key support and resistance levels, or providing insightful analysis to his clients and followers, Aayush’s unwavering dedication to his craft sets him apart as a true industry leader and a beacon of inspiration to aspiring traders around the globe.

In a world where uncertainty reigns supreme, Aayush Jindal stands as a guiding light, illuminating the path to financial success with his unparalleled expertise, unwavering integrity, and boundless enthusiasm for the markets.

Ethereum Prepares For Potential Rally To $6,000, Analyst Says

Following a slight price dip on Friday, Ethereum (ETH) has displayed much resilience climbing by 2.84% in the past 24 hours. Commenting on the altcoin’s possible next movements, crypto analyst Ali Martinez has painted a potential trajectory to a new all-time high at $6,000.

Ethereum Now At Critical Support Zone – Here’s Why

In an X post on Saturday, Martinez shares that Ethereum is currently testing a key support level at $2,400. Notably, Ethereum slipped to around $2,410 on Friday and has since remained in this price zone following a recent rejection at $2,500. According to Ali Martinez, ETH must maintain support at $2,400 to avoid breaking an ascending channel that stretches as far back as July 2023.

Based on the analyst’s trading chart, a successful retest at the specified support zone will allow ETH to surge above the $3,000 mark before experiencing a consolidation between $3,350 – $3,750. Thereafter, another price breakout will occur which should push Ethereum’s price to the upper end of its ascending channel around $6,000, indicating a potential 142% gain on the asset’s current market price.

However, If Ethereum bulls fail to hold the support at $2,400, the altcoin could fall by 40% finding a new support level at $1,500. To avoid significant losses in this high “risk to reward” situation, Ali Martinez has advised traders to put a stop loss between $2,150 – $2,300.


Ethereum

Coinbase Premium Negative Index Signals Bearish Sentiment For ETH Market

In other news, CryptoQuant analyst Darkfost has noted that the Ethereum Coinbase Premium Index is currently at -2 and is highly negative. According to Darkfost, this development indicates that US institutional investors or market whales are currently aggressively offloading their ETH holdings. 

For short-term traders, this is a strong bearish signal as Ethereum is likely to experience a downtrend in the coming days. However, Darkfost states that long-term traders may want to utilize such price decline as a perfect accumulation opportunity.

At the time of writing, ETH trades at $2,473 per unit. While the altcoin might have recorded a minor gain in the past day, a decline of 6.47% and 6.27% in the last seven and thirty days, respectively, still leaves much for investors to desire. In addition, Ethereum’s daily trading volume, valued at $12.22 billion, reflects a  48.27% decline representing a reduced market liquidity and potential heightened price volatility.

Ethereum

Featured image from Dribble, chart from Tradingview


Bitcoin Price To Go ‘Vertical’ Towards $200,000 As Crypto Analyst Points Out Massive Cup And Handle Pattern

Este artículo también está disponible en español.

The Bitcoin price could see its price surging dramatically to $200,000, with the formation of a new Cup and Handle pattern. While the pioneer cryptocurrency has been slowly recovering from bearish trends to reach the $70,000 mark, a rally to $200,000 would mark a historical milestone and a new All-Time-High (ATH) for BTC. 

Technical Pattern Signals $200,000 Rally Ahead

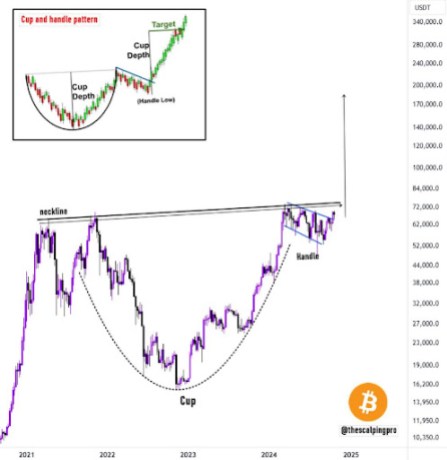
Popular crypto analyst, Mags has unveiled a new technical pattern in the Bitcoin price chart. According to his post on X (formerly Twitter), Bitcoin is currently forming “a massive cup and handle pattern,” indicating a potential for a major rally

Related Reading

Mags revealed that the Bitcoin price has just moved past the handle portion in the technical pattern, indicating a positive signal for a breakout that could start a bullish phase. As its name suggests, a Cup and Handle pattern is a key technical chart pattern that resembles a cup and handle. In this chart pattern, the cup is in the shape of a U and is considered a bullish signal, while the handle represents a slight downward drift, which indicates a potential buying opportunity to go long. 

Bitcoin price 1
Source: X

Mags observed that since Bitcoin has just broken past the handle, the next level is to watch the “neckline” which serves as a resistance point. If Bitcoin can break through the neckline, it’s price could surge dramatically or like the analyst says “go vertical.” This bull rally could see Bitcoin’s price driving towards $200,000, marking a new all time high for the cryptocurrency.

Currently, the price of Bitcoin is trading at $66,972, reflecting a slight 2.02% decrease in the past seven days, according to CoinMarketCap. While Mags has projected a $200,000 price increase for Bitcoin, the analyst has also forecasted even higher price targets in previous X posts, suggesting that a $200,000 price level may be conservative for the world’s first and largest cryptocurrency. 

Bitcoin Price Peak Set At $300,000

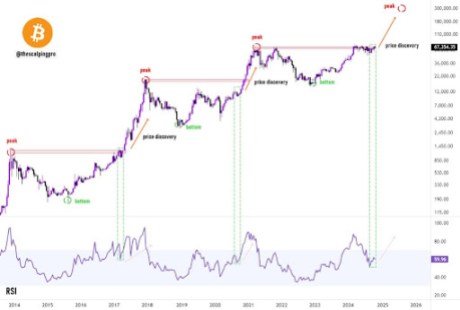
In another X post on October 24, Mags disclosed that Bitcoin is about to enter its price discovery, suggesting an imminent breakout to new levels. Price discovery is the process by which an asset’s true market value is determined, and for Bitcoin, it suggests when its price could reach fresh highs.  

Related Reading

Sharing a historical Bitcoin price chart, the analyst pinpointed instances where the cryptocurrency entered a price discovery before reaching a peak. In 2014, BTC hit a peak, then bottomed out in 2015 before reaching another price high in 2018. A similar price action occurred between 2019 and 2024, with BTC achieving a bottom in 2019 and peaking in 2021. 

Bitcoin price 2
Source: X

Following this historical price trend, Mags indicated that Bitcoin hit its bottom in 2023 and is now about to enter its price discovery. Once the cryptocurrency does, it could signal a surge to a new all-time high, which Mags has set at an impressive $300,000. 

Bitcoin price chart from Tradingview.com
BTC price struggles to hold $67,000 | Source: BTCUSD on Tradingview.com

Featured image created with Dall.E, chart from Tradingview.com

Bitcoin Exchange Whale Ratio Hits New High Since 2022 — Impact On Price?

Opeyemi is a proficient writer and enthusiast in the exciting and unique cryptocurrency realm. While the digital asset industry was not his first choice, he has remained absolutely drawn since making a foray into the space over two years. Now, Opeyemi takes pride in creating unique pieces unraveling the complexities of blockchain technology and sharing insights on the latest trends in the world of cryptocurrencies.

Opeyemi savors his attraction to the crypto market, which explains why he spends the better parts of his day looking through different price charts. “Looking” is a rather simple way to describe analyzing and interpreting various price patterns and chart formations. However, it appears that is not Opeyemi’s favorite part – in fact, far from it.

Being able to connect what happens on a price chart to on-chain movements and blockchain activities is what keeps Opeyemi ticking. “This emphasizes the intricacies of blockchain technology and the cryptocurrency market,” he would say. Most importantly, Opeyemi thinks of any market insights as the gospel, while recognizing that he is only a messenger.

When he is not clicking away at his keyboard, Opeyemi is most definitely listening to music, playing games, reading a book, or scrolling through X. He likes to think he is not loyal to a particular genre of music, which can be true on many days. However, the fast-rising Afrobeats genre is a staple in Opeyemi’s Spotify Daily Mix.

Meanwhile, Opeyemi is a voracious reader who enjoys a wide category of books – ranging from science fiction, fantasy, and historical, to even romance. He believes that authors like George R. R. Martin and J. K.
Rowling are the greatest of all time when it comes to putting pen to paper. Opeyemi believes his reading of the Harry Potter series twice is proof of that.

Indeed, Opeyemi enjoys spending most of his time within the four walls of his home. However, he also sometimes finds solace in the company of his friends at a bar, a restaurant, or even on a stroll. In essence, Opeyemi’s ambivert (haha! been searching for an opportunity to use the word to describe myself) nature makes him a social chameleon who is able to quickly adapt to different settings.

Opeyemi recognizes the need to constantly develop oneself in order to stay afloat in a competitive and ever-evolving market like crypto. For this reason, he is always in learning mode, ready to pick up the slightest lesson from every situation. Opeyemi is efficient and likes to deliver all that is required of him in time – he believes that “whatever is worth doing at all is worth doing well.” Hence, you will always find him striving to be better.

Ultimately, Opeyemi is a good writer and an even better person who is trying to shed light on an exciting world phenomenon – cryptocurrency. He goes to bed every day with a smile of satisfaction on his face, knowing that he has done his bit of the holy assignment – spreading the crypto gospel to the rest of the world.

Solana (SOL) Breaks Past $176 In 3-Month Push

Este artículo también está disponible en español.

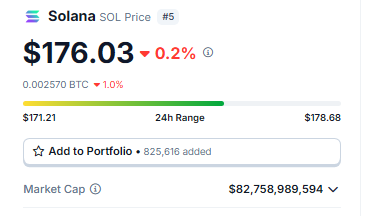
The Solana native coin is generating news as it goes against the trend, lately surpassing $176 in a move that has piqued the crypto world’s interest. This gain is especially surprising given the sour mood around the crypto just weeks ago, with several analysts predicting the altcoin would suffer.

SOL breaks past $176. Source: Coingecko

Related Reading

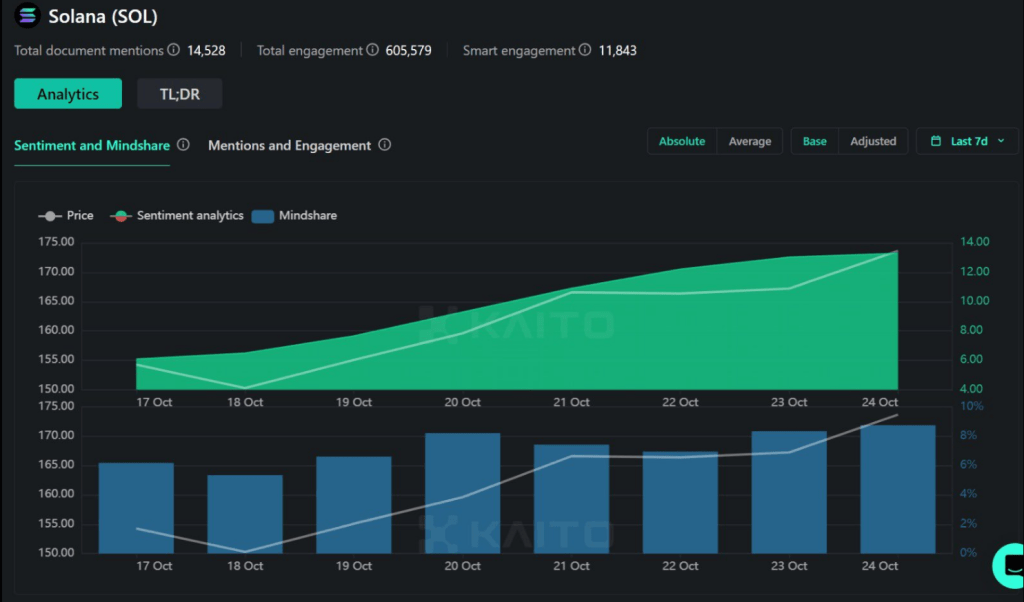
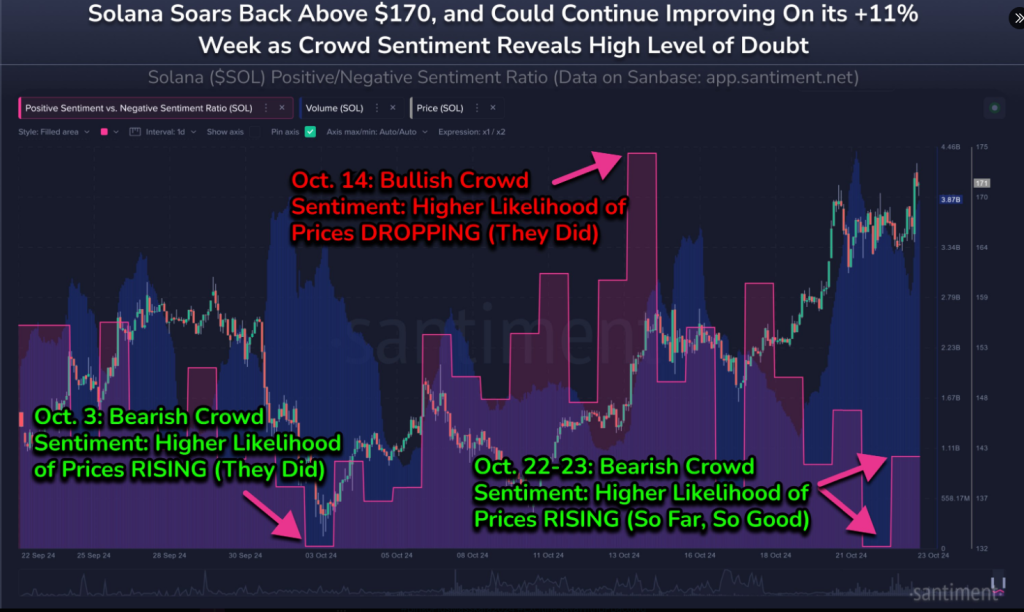
But Solana has defied the odds, increasing both in price and in market confidence. According to analyst Miles Deutscher, the gain coincides with a broader increase in positive sentiment for Solana, encouraging industry-wide discussions about its potential.

Technical signs indicate an even brighter future for the fifth-largest altcoin. According to experts, Solana’s present trajectory, which is supported by a bullish pennant pattern, indicates that SOL might reach as high as $260 if it breaks past resistance.

Increasing Interest And Technical Indicators

As Solana’s price rose, observers saw a dramatic surge in positive sentiment about the asset. According to data, the number of discussions surrounding Solana has contributed to the upsurge observed in the slant.

Mindshare (a measure of the percentage of crypto discussions a coin commands) has remained high. For Deutscher, the increasing attentiveness on Solana is a sign that there is even more room for growth, contrary to the prevailing tendency in the market.

Although some investors are wary, experts say the technical terrain is still favorable. If the item breaks over its barrier, the optimistic pennant formation in SOL’s price action usually denotes more gains. Depending on if Solana can break out from its present level, its token’s price might be positioned for a notable climb toward $260.

SOL market cap currently at $82.8 billion. Chart: TradingView.com

The Ethereum-Solana Rivalry

Surprisingly, Solana’s comeback happens at the same time that Ethereum co-founder Anatoly Yakovenko shows his accolade on Ethereum. Solana and Ethereum are competitors, but Yakovenko recently praised Ethereum’s core technology and said he liked its design and goal.

This is of interest to people as they are generally two competing networks that try to outdo each other in offering superior decentralized apps and smart contracts functionality.

Related Reading

Ethereum has long been the preferred protocol among developers, but Solana, dubbed a “Ethereum-killer,” has quickly gained favor because to its speed and lower transaction fees. Yakovenko’s recognition demonstrates a developing sector in which competitors can acknowledge each other’s contributions to blockchain innovation.

Future Perspectives And Market Sentiment

Meanwhile, Deutscher feels Solana’s price might double or possibly quadruple, particularly if Bitcoin rises to new highs, say $100,000. SOL’s continued performance despite recent falls suggests that it may have strong community and long-term holders. For the time being, SOL is a coin to keep an eye on, and with increased sentiment and a technical boost, it appears to be on track to continue challenging expectations.

Featured image from Pintu, chart from TradingView


On-Chain Indicator Signals Bitcoin Cycle Top Is Far Ahead – Data Confirms Bullish Outlook

Este artículo también está disponible en español.

Bitcoin currently ranges between $65,000 and $69,500 following two weeks of bullish price action, sparking renewed optimism among analysts and investors. The prevailing sentiment is that BTC is on the verge of reaching new all-time highs in the coming weeks, with confidence building that March’s cycle top predictions may have been premature. 

Related Reading

Key metrics from CryptoQuant reveal that Bitcoin is still far from typical cycle-top conditions, instead signaling a bullish outlook as we move into November. As the U.S. election approaches November 5 and macroeconomic factors continue to shift, price action is expected to remain unpredictable and volatile.

Market participants are watching closely, expecting that geopolitical and economic events could influence BTC’s trajectory. Given this context, many believe the next major move for Bitcoin could catalyze a fresh leg up, potentially breaking through previous highs.

Bitcoin Calm Before The Storm?

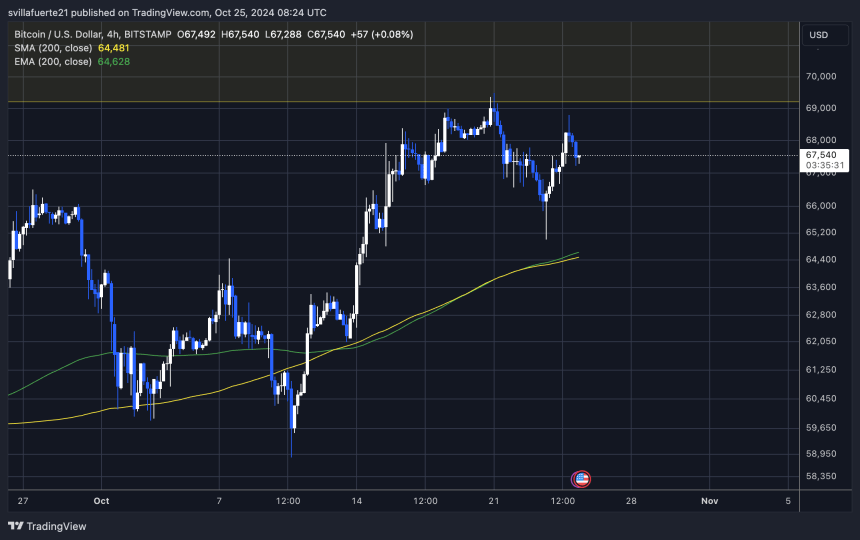
Bitcoin is holding firm above $67,000, showing resilience as it edges to a potential breakout above $70,000. However, the current price action indicates that Bitcoin may consolidate below this key level before moving up to new highs in the next leg. Market participants closely watch BTC’s behavior around these price levels, as a sustained push above $70,000 could set the stage for significant gains.

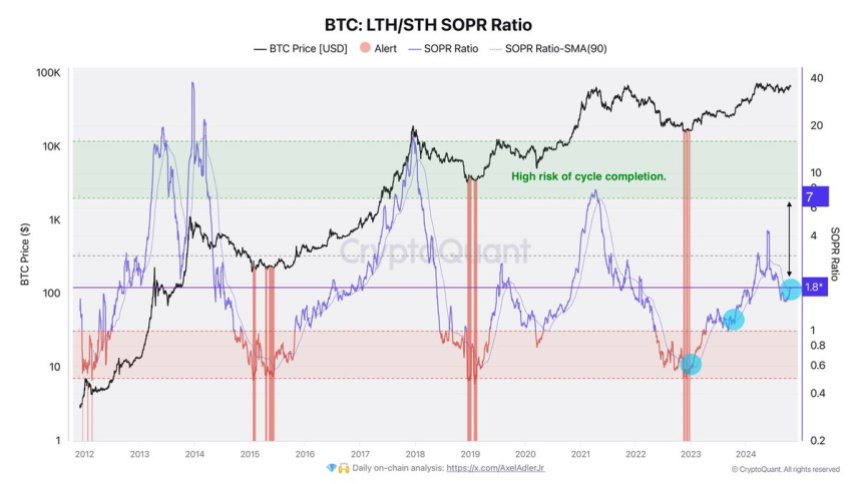
CryptoQuant analyst Axel Adler recently shared critical insights on X, highlighting the current Long-Term Holder (LTH) to Short-Term Holder (STH) SOPR Ratio, which sits at 1.8. This metric is often used to gauge selling pressure and market sentiment, with higher levels indicating increased profit-taking that could signal a market peak. 

Bitcoin LTH/STH SOPR Ratio at 1.8. Risk of cycle culmination when it rises to 7
Bitcoin LTH/STH SOPR Ratio at 1.8. Risk of cycle culmination when it rises to 7 | Source: Axel Adler on X

According to Adler, when this ratio climbs to around 7, Bitcoin will be nearing a cycle culmination. The ratio’s bullish cross with its 90-day moving average reflects a positive outlook, supporting the narrative that BTC remains well below its cycle top.

Related Reading

This metric’s movement and broader market strength paint a favorable picture for Bitcoin’s price action in the coming weeks. The data suggests that Bitcoin still has room to grow within this cycle, providing confidence to long-term holders and investors looking for continued upside.

BTC Technical Levels

Bitcoin is trading at $67,500, facing challenges after failing to maintain its bullish structure on the 4-hour chart. The price couldn’t set a new high above $69,500, marking a potential shift in momentum. A crucial support level now sits at $65,000, the local low that previously held the bullish trend intact. Holding above this level is essential to prevent a broader retrace and maintain confidence among bulls.

BTC ranging between $69,500 and $65,000 (4H)
BTC ranging between $69,500 and $65,000 (4H) | Source: BTCUSDT chart on TradingView

Currently, price action remains indecisive, leaving the direction for the coming days unclear. A breakout above $69,500 would restore the bullish structure, likely drawing more buyers into the market and signaling another rally attempt. Conversely, a break below the $65,000 support would signal a retrace, potentially leading BTC to lower demand zones as bulls look to regroup.

Related Reading

The current consolidation phase highlights the importance of these levels in determining Bitcoin’s short-term trajectory. With both bulls and bears vying for control, BTC’s ability to hold above $65,000 will be crucial to retaining bullish sentiment.

Featured image from Dall-E, chart from TradingView

Dogecoin (DOGE) Poised for Another Rise: Can Bulls Drive Higher?

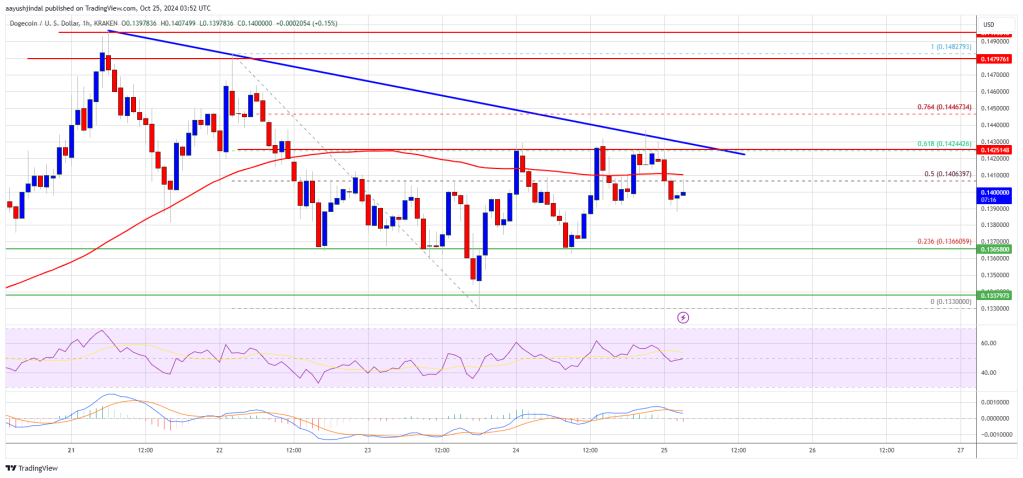
Dogecoin is consolidating above the $0.1320 support zone against the US Dollar. DOGE must clear the $0.1425 resistance to start another increase.

  • DOGE price started a downside correction from the $0.1500 resistance level.
  • The price is trading below the $0.1420 level and the 100-hourly simple moving average.
  • There is a key bearish trend line forming with resistance at $0.1425 on the hourly chart of the DOGE/USD pair (data source from Kraken).
  • The price could gain bullish momentum if it clears the $0.1425 and $0.1450 resistance levels.

Dogecoin Price Eyes Upside Break

Dogecoin price started a downside correction from the $0.1500 resistance zone. DOGE dipped below $0.1450 and $0.1420 levels. A low was formed at $0.1330 and the price is now recovering losses like Bitcoin and Ethereum.

There was also a move above the $0.1350 and $0.1380 resistance levels. The price surpassed the 50% Fib retracement level of the downward move from the $0.1482 swing high to the $0.1330 low. However, the bears are active near the $0.1425 resistance zone.

There is also a key bearish trend line forming with resistance at $0.1425 on the hourly chart of the DOGE/USD pair. The trend line is close to the 61.8% Fib retracement level of the downward move from the $0.1482 swing high to the $0.1330 low.

Dogecoin price is now trading below the $0.1420 level and the 100-hourly simple moving average. Immediate resistance on the upside is near the $0.1425 level. The next major resistance is near the $0.1450 level.

Dogecoin (DOGE)

A close above the $0.1450 resistance might send the price toward the $0.1500 resistance. Any more gains might send the price toward the $0.1550 level. The next major stop for the bulls might be $0.1585.

Another Decline In DOGE?

If DOGE’s price fails to climb above the $0.1425 level, it could start another decline. Initial support on the downside is near the $0.1365 level. The next major support is near the $0.1350 level.

The main support sits at $0.1320. If there is a downside break below the $0.1320 support, the price could decline further. In the stated case, the price might decline toward the $0.1250 level or even $0.1220 in the near term.

Technical Indicators

Hourly MACD – The MACD for DOGE/USD is now losing momentum in the bullish zone.

Hourly RSI (Relative Strength Index) – The RSI for DOGE/USD is now near the 50 level.

Major Support Levels – $0.1365 and $0.1320.

Major Resistance Levels – $0.1425 and $0.1450.

Bitcoin Whale Numbers Return To January 2021 Bull Market Levels, Is A New ATH Coming?

Este artículo también está disponible en español.

Recent on-chain data has revealed a new milestone for Bitcoin whales, i.e., addresses holding at least 1,000 BTC. Notably, the data for Bitcoin whales shows the number of addresses in this category is now at its highest point since the January 2021 bull market levels. 

With Bitcoin still trading close to its all-time high, this new whale milestone brings into question a better chance of Bitcoin breaking above and creating a new all-time high very soon.

Whale Activity And Holder Count Reaches New Highs

Bitcoin whales have always been one of the most important indicators for ongoing sentiment among traders and long-term holders. According to Glassnode data presented by André Dragosch, director and head of research for Europe at Bitwise, the number of addresses that fall into the whale category has been on a steady climb since January 2024, where it stood just below 1,500 addresses.

Related Reading

The current market climate and inflow from institutional investors have allowed this upward trajectory to persist over the past months, pushing it past multiple levels. The most recent figures reveal that the number of Bitcoin addresses holding at least 1,000 BTC has reached 1,678, marking the highest point in whale activity since January 2021, during the height of the last major bull run.

Bitcoin

What this suggests is that each of these addresses now holds at least $67 million worth of Bitcoin, given the current price of the cryptocurrency.

New All-Time High Incoming?

Whale accumulation leading up to the previous highest level in January 2021 was one of the key factors that drove the Bitcoin price to peak above $69,000 in 2021. 

Although the Bitcoin price has now broken above this previous peak to create an all-time high of $73,737 in March 2024, the same accumulation pattern appears to be unfolding. This interesting accumulation of BTC by Bitcoin whales has proven to be the much-needed boost to stop deeper price corrections after a false breakout of a descending triangle earlier in the week.

Related Reading

Even with the false breakout, the overall sentiment around Bitcoin remains optimistic. According to on-chain analytics provider CryptoQuant, it’s not just the whales driving the market. Retail investors have also joined the action. On-chain data shows a 13% rise in retail demand over the last 30 days, a notable increase that mirrors the retail interest seen in March 2024, just before Bitcoin reached its latest all-time high. 

At the time of writing, Bitcoin is trading at $67,000, having traded between $65,161 to $67,538 in a 24-hour range and $65,441 to $69,227 in a seven-day range. 

Interestingly, Bitcoin is only about 10% away from surpassing its all-time high once again. With this increased buying interest and whale accumulation, Bitcoin seems ready for another breakout to set a new price record before the end of 2024.

Bitcoin price chart from Tradingview.com
BTC price pushes above $67,000 | Source: BTCUSD on Tradingview.com

Featured image created with Dall.E, chart from Tradingview.com