Category Archive : News

Bitcoin Price To $95,000? Here’s What Needs To Happen First

Este artículo también está disponible en español.

The Bitcoin price has now broken above the $68,000 mark amid a run of a 12% price increase in the past seven days. However, analysis says the Bitcoin price will not stop this surge anytime soon. According to a detailed analysis posted on TradingView, a well-known crypto analyst has shared insights suggesting that Bitcoin is on track to climb even higher to reach an ambitious target of $95,000, but USDT.D needs to break below the lower boundary of a triangle first.

Interesting Take On Bitcoin Price Outlook

The analyst in question, known as TheSignalyst, takes an unconventional approach to analyzing Bitcoin’s price movement by relying on a lesser-known but intriguing metric. 

Related Reading

According to TheSignalyst, the USDT.D chart, which tracks the dominance of the stablecoin Tether (USDT) in the cryptocurrency market, efficiently tracks the overall sentiment of the crypto market. Though not widely used by mainstream analysts, this metric has proven useful in predicting market tops, bottoms, and future price action.

According to the USDT.D chart, the USDT dominance has been playing out a descending triangle pattern since the first days of August. Since this period, the USDT dominance has ranged between 6.5% and 5.34% of the total crypto market cap up until the time of writing. As the analyst noted, as long as USDT dominance remains within the descending triangle, Bitcoin’s price is likely to continue consolidating in a range.

However, TheSignalyst adds that for Bitcoin to truly enter a bullish run, the USDT dominance needs to break downward. Specifically, it would have to fall below the lower boundary of the descending triangle and drop beneath 5.2% of the total crypto market cap. 

What Does This Mean For The BTC Price?

As the largest stablecoin, the USDT dominance can reveal a lot about the prevailing sentiment among crypto traders. High periods of USDT dominance suggest investors are pulling out of riskier assets and parking their funds in stablecoins, while a decline in the USDT dominance suggests inflows into cryptocurrencies.

Related Reading

In the case of TheSignalyst’s analysis, the USDT dominance breaking below 5.2% would signal reduced reliance on the stablecoin and a renewed appetite for riskier assets, paving the way for Bitcoin to embark on a more aggressive upward trajectory. 

According to the analyst, if this scenario unfolds, it could enable Bitcoin’s price to break past the $70,300 mark in the weekly timeframe. This level sits just above a descending trendline that has been stopping Bitcoin’s momentum since April, and a successful breakout could confirm the start of a much larger rally.

In the case of such a breakout, the analyst suggests a strong surge towards the $100,000 price level. At the time of writing, Bitcoin is trading at $68,100 and is about 47% away from this six-figure target.

Bitcoin price chart from Tradingview.com
BTC price fails to hold $68,000 | Source: BTCUSD on Tradingview.com

Featured image created with Dall.E, chart from Tradingview.com
Analyst Predicts Longs Could Benefit

Este artículo también está disponible en español.

Recent reports have revealed that Ethereum has had a challenging run, underperforming compared to other major cryptocurrencies. However, despite this, some positive signs may be on the horizon.

According to a CryptoQuant analyst, Percival, Ethereum’s open interest has increased significantly, indicating rising investor optimism for a potential rally.

Related Reading

Potential For Ethereum Rally And Longs Benefit

According to the data shared by Percival, Ethereum’s open interest stands at $9.6 billion, marking a 28.57% increase from August, although it is still below the $13 billion recorded in June.

The rise in open interest points to expectations of an upward price movement, with many traders positioning themselves for increased demand.

Percival noted that several factors, including potential Federal Reserve interest rate cuts and a growing focus on the future of tokenization on the Ethereum blockchain, may fuel this uptick.

This shift could drive more interest toward decentralized finance (DeFi) protocols, making Ethereum more attractive for investors looking for long-term gains.

Percival also highlighted that Ethereum’s Relative Strength Index (RSI) is at 61, suggesting that the market is overheated.

A “convergence” between open interest and RSI levels indicates that price corrections will likely be short-lived, providing opportunities for traders to position themselves for a market rebound.

The analyst estimated that Ethereum may experience a correction of around 7% to 9% before rallying again, favoring long positions as traders await a potential rise in both price and demand.

The analyst particularly wrote in a post on the CryptoQuant QuickTake platform:

The convergence of the highest lows in the RSI suggests a potential for a less pronounced correction, estimated to be between 7% and 9%. This scenario favors long positions, with traders patiently waiting for a market rebound to confirm new highs and higher lows.

ETH’s Path To A Bullish Breakout

At the time of writing, Ethereum trades at $2,611, down slightly by 0.1% in the past 24 hours. This comes after a strong week where the cryptocurrency saw a 9.3% increase and a nearly 15% rise over the past month.

Ethereum (ETH) price chart on TradingView
ETH price is moving upwards on the 2-hour chart. Source: ETH/USDT on TradingView.com

According to another prominent crypto analyst, Ali, Ethereum could be on the verge of a significant rally. In a recent post on X, Ali revealed that Ethereum has recently touched the lower boundary of a channel, a level that has historically led to an average 130% price surge.

Related Reading

According to Ali, should this pattern continue to hold, Ethereum could potentially climb to $6,000 as long as it maintains its key support level of $2,300.

So far, despite ETH’s market’s volatility, the asset has managed to maintain its price above the critical $2,300 support level, which lends credibility to the theory that a bullish breakout could be on the way.

Featured image created with DALL-E, Chart from TradingView


Blockchain Data Reveals Lackluster Response To Trump New Crypto Token Launch

Este artículo también está disponible en español.

Donald Trump new cryptocurrency initiative, World Liberty Financial (WLF), has encountered significant challenges since its launch. According to a report by CNBC, the project aims to establish a crypto bank and was expected to attract considerable investor interest. However, the token sale, which began on Tuesday, was marred by website outages and technical issues, severely limiting participation.

Trump Crypto Venture Faces Setbacks

Zachary Folkman, co-founder of WLF, had previously indicated that over 100,000 individuals were on the whitelist for the investment opportunity. Despite this promising start, the reality was starkly different. 

Related Reading

As of Tuesday afternoon, blockchain data from Etherscan revealed that only about 4,300 unique wallet addresses held the WLF token, amounting to roughly 4% of the registered investors.

The platform reported selling more than 532 million tokens at a price of 15 cents each, which represents less than 3% of the total 20 billion tokens available for public sale. 

Throughout the day, users faced consistent disruptions, with the website often displaying a message stating, “We are under maintenance.” WLF has yet to provide an official comment regarding these technical difficulties.

These setbacks come at a crucial time for Trump, who is the Republican presidential nominee and has heavily promoted the project since August under the branding “The DeFiant Ones,” a nod to decentralized finance (DeFi). 

The project’s roadmap indicates an ambitious goal of raising up to $300 million at a $1.5 billion valuation during the initial sale.

Investors To Receive Voting Rights On WLF Platform

Folkman, who has a varied entrepreneurial background, including a previously owned company, Date Hotter Girls, has stated that 20% of WLF’s tokens are allocated to the founding team, which includes members of the Trump family. 

The WLF token, WLFI, is structured as a Regulation D offering, allowing it to raise capital without registering as a security with the SEC, provided it meets certain conditions, such as limiting the sale size and restricting participation to accredited investors. So far, details about the project’s functionalities remain sparse. 

Related Reading

Individuals associated with the Trump family project have suggested that the platform will facilitate borrowing, lending, and investing in cryptocurrencies. However, a formal white paper or comprehensive business plan has not been made public, and the primary disclosure has been that investors will receive voting rights on the forthcoming WLF platform.

In a step toward legitimacy, WLF has also initiated the process of obtaining approval from Aave, a DeFi ecosystem and lending platform known for its open-source framework and reputation in the crypto community.

Trump
The daily chart shows the total crypto market cap valuation at $2.24 trillion. Source: TOTAL on TradingView.com

Featured image from DALL-E, chart from TradingView.com

Solana Meme Coins Rising But Is This Deployer Dumping On Degens?

Crypto prices are printing higher. Bitcoin, for example, broke above $66,000 before cooling off earlier today. Like the world’s most valuable coin, Solana and its meme coins are trending higher. According to Coingecko, SOL trades above $150, adding nearly 7% in the previous trading week.

Meme Coins Soaring But PELF Deployer Dumping

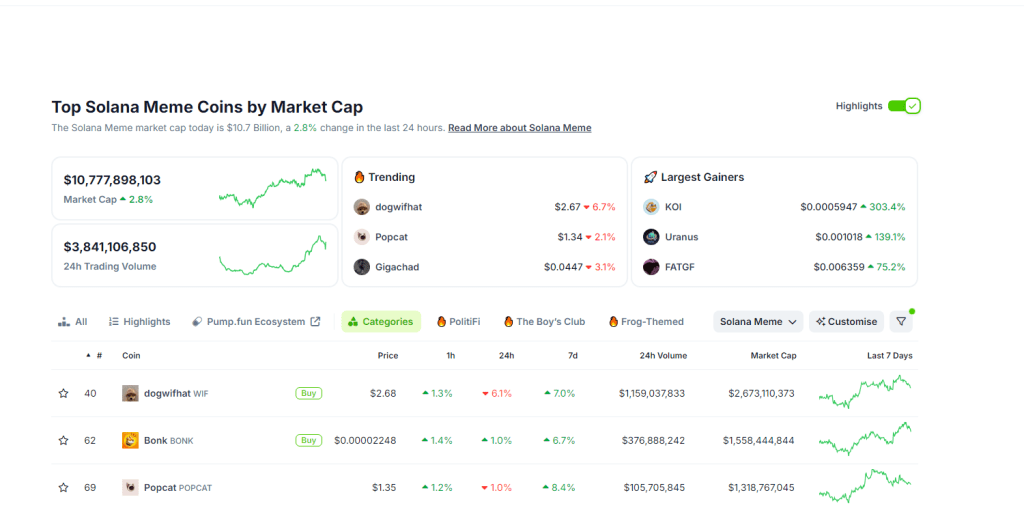
The lift-off in Solana has seen some of its ecosystem tokens massively benefit. Among the many, Solana-based meme coins continue to rip higher. According to Coingecko, three Solana meme coins, including Popcat and DogWifHat, now command a market cap above $1 billion.

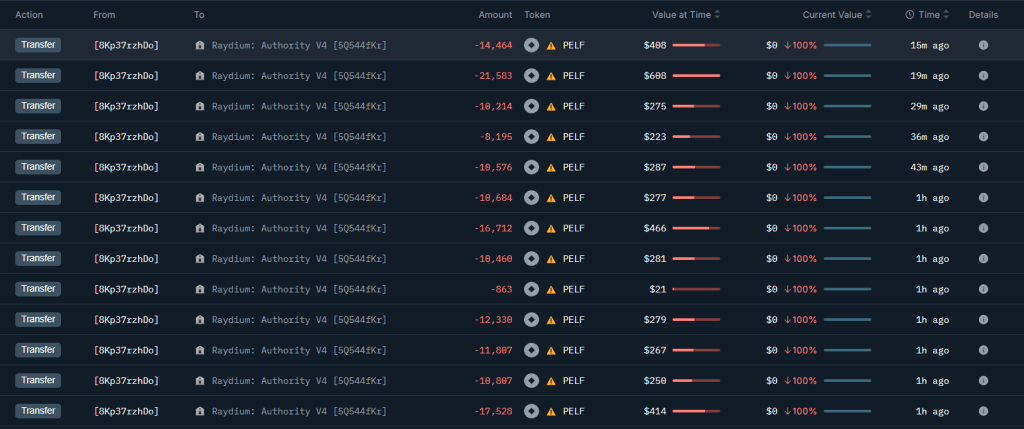
While investors are closely tracking the performance of Popcat, the first cat-themed meme coin to break above the $1 billion level, some whales are fading the current bull run. One analyst, citing Nansen data, observes that the deployer of the PELF, a meme coin on Solana, is offloading.

Initially, the deployer received 247 million PELF for 82 SOL worth $12,516. Later, the addresses received another 39.13 million PELF. According to on-chain data, the address has sold 3.2 million PELF for 662 SOL.

PELF deployer selling | Source: @OnchainLens via X

Although analysts believe the deployer might have offloaded more tokens through other unknown addresses, the whale currently owns over $7.8 million worth of PELF at spot rates.

Usually, any liquidation by a whale is considered bearish and might significantly influence price action. Retail traders, some interested in meme coins, often closely monitor the accounts of known whales, including deployers. If they choose to sell, moving tokens to a DEX, speculators will also look to sell before prices tank.

Will Improving Crypto Sentiment Drive Demand?

PELF remains in an uptrend, judging by the formation in the daily chart. The token is up nearly 300% from September lows. However, PELF is inside a broader range and down from its March 2024 highs.

PELF prices moving upward on the daily chart | Source: PELFUSDT on MEXC, TradingView

If buyers are to take charge, there must be a confirmation of October 14 gains. In that case, PELF could break above $0.0008101, bottoming out from Q3 2024 lows.

Improving crypto sentiment could lift meme coins, driving them to new valuations. As of October 15, the total market cap of Solana meme coins exceeds $10.9 billion.

Solana meme coins rising | Source: Coingecko

Interestingly, they continue to grow in strength, looking at the number of Solana meme coins breaking into the top 10. According to Coingecko, Dogecoin is still the most valuable. However, DogWifHat, Bonk, and Popcat are now among the top 10, flipping Floki, Neiro on Ethereum and Brett.

Bitcoin Open Interest Hits Record $19.8 Billion—Is The $100K Rally About to Begin?

The Bitcoin price is rising, reaching as high as $66,173 today; the asset appears to have hit a milestone behind the scenes.

According to a CryptoQuant analyst, EgyHash, Bitcoin’s open interest—a measure of the total number of outstanding derivative contracts—has reached a new all-time high.

This development signals heightened activity in the Bitcoin market and suggests strong sentiment among traders.

Detailing The Open Interest ATH

In a post on the CryptoQuant QuickTake platform, EgyHash detailed the significance of this new peak in Bitcoin’s open interest.

The analyst noted, “Bitcoin’s open interest has reached a new all-time high of $19.8 billion. Additionally, funding rates have hit their highest positive levels since August, indicating that much of this open interest is skewed toward long positions.”

Bitcoin Open Interest.

Notably, the rise in open interest and increasing funding rates point to a bullish outlook among traders, signaling their confidence in Bitcoin’s continued upward movement.

EgyHash further emphasized that this trend in the derivatives market reflects a growing influx of liquidity and increased attention in cryptocurrency.

While Bitcoin’s open interest has been climbing, the asset’s price has also seen significant upward movement. Over the past 24 hours, Bitcoin’s value increased by 5.1%, trading at $65,655, following a brief rally to over $66,000.

Bitcoin (BTC) price chart on TradingView

This price increase has been accompanied by a notable rise in Bitcoin’s overall market capitalization, which currently stands at $1.297 trillion, up from $1.175 trillion just last week.

Bitcoin’s trading volume has also surged, doubling from below $20 billion over the weekend to over $40 billion today.

Bitcoin Price Outlook

The rising market activity and price gains have led several crypto analysts to weigh in on Bitcoin’s future trajectory. One prominent analyst, Trader Tardigrade, shared his bullish outlook, revealing that there has been a breakout in Bitcoin Stochastic.

According to Tardigrade, this breakout has the same pattern as the previous cycle. The analyst added: “The breakout point indicates the local bottom at the root of a MASSIVE Parabolic RALLY. Send $BTC to $500k.”

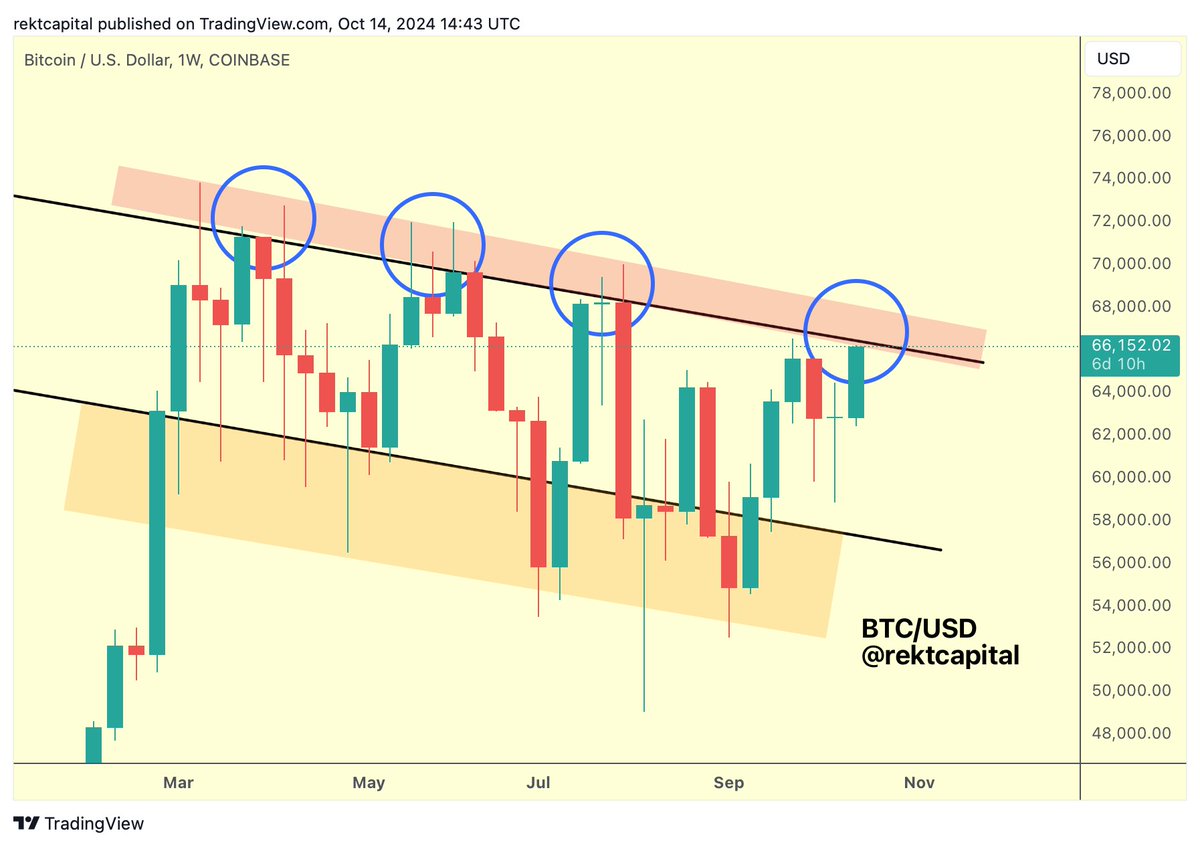
Despite the optimistic outlook from several traders, other analysts are urging caution. RektCaptal, another well-known figure in the crypto space, suggested that Bitcoin needs to secure a weekly close above its current downtrend channel to confirm a sustained breakout.

Image

He noted, “Bitcoin needs to Weekly Close above the black Downtrending Channel Top to finally break out from this Channel.”

Featured image created with DALL-E, Chart from TradingView


Toncoin Sharpe Ratio Rising, Is TON Readying For $8?

Toncoin has cemented its position as a top 10 coin. However, considering the weakness across the board, TON, the native currency, has not been spared the hammering. Although losses might be contained, the coin is down nearly 36% from 2024 highs, finding strong support at around $4.5.

TON buyers are confident prices will recover, breaking above $6 in the coming sessions. However, its performance will be shaped by market sentiment and how Bitcoin reacts to local support and resistance lines.

TON Sharpe Ratio Rising

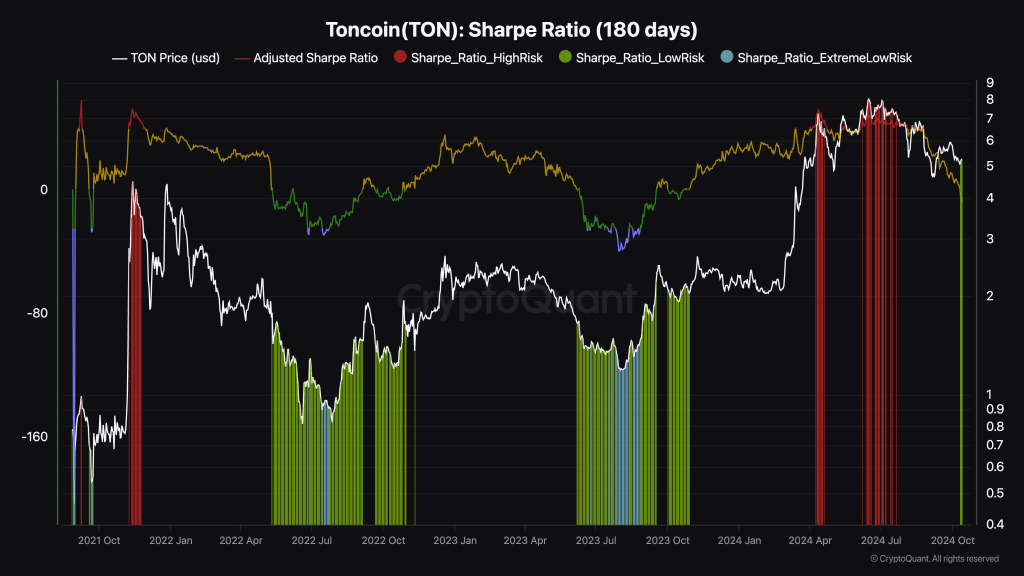
While there are external factors to consider, one analyst notes that the Toncoin Sharpe Ratio is rising and is now in the “low-risk zone.” Based on the analyst’s assessment, TON offers a favorable risk-reward balance for holders and investors.

Analysts use the Sharpe Ratio to gauge the risk-adjusted rate of return. The return is higher when it rises, even after factoring in existing risks.

Toncoin Sharpe Ratio | Source: @TeddyVision via CoinMarketCap

How prices perform depends on, among others, prevailing sentiment and adoption. As of mid-October, 77% of all TON traders expect prices to edge higher, looking at a CoinMarketCap poll.

The analyst added that the improvement is noticeably better than last year when the Sharpe Ratio was in a “high-risk” zone. It remains to be seen whether prices will recover in the coming sessions.

Toncoin Holders Exceed 90 Million: Will A Bitcoin Rally Spark Demand?

Over the past few trading months, TON has grown in prominence, cementing its position in the top 10. The rapid valuation follows the success of some of its protocols, including the tap-to-earn game, Hamster Kombat. At the same time, meme coin interest is taking up shape in Toncoin, looking at trading volume associated with Dogs.

According to on-chain data, the growth of Toncoin has seen its user base expand. As of early October, there were nearly 90 million TON holders, a 24X rise over the past year. With Toncoin dapps finding adoption, the more users choose to engage, buying TON, pushing prices even higher.

Toncoin price moving sideways on the daily chart | Source: TONUSDT on OKX, TradingView

If Bitcoin rises, breaking above $66,000 and $70,000 in the coming sessions, the probability of TON rising in tandem will be higher. As mentioned earlier, a decisive breakout above $6 could anchor the next leg up to June 2024 highs.

Ethereum Price Gains Bullish Momentum: Is a Breakout Near?

Este artículo también está disponible en español.

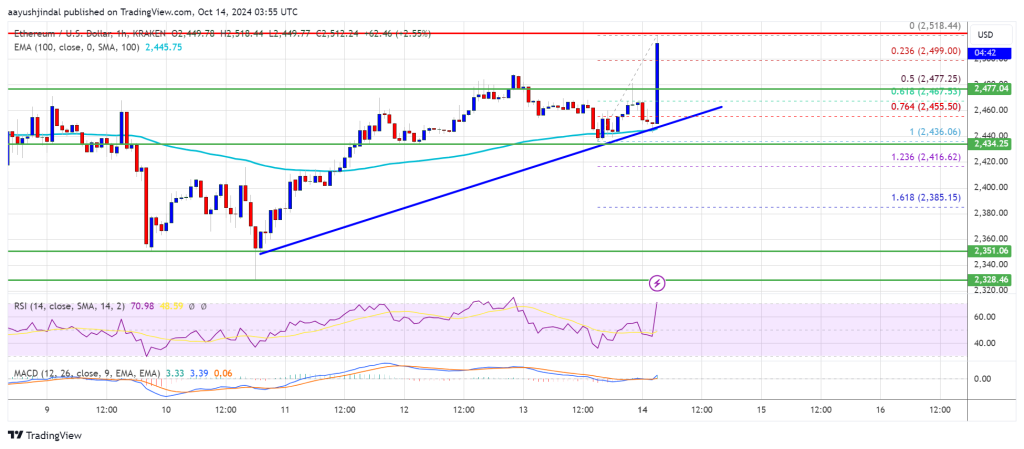
Ethereum price started a steady increase above the $2,450 resistance. ETH is holding gains and might gain bullish momentum above $2,520.

  • Ethereum started a steady increase above the $2,420 and $2,450 resistance levels.
  • The price is trading above $2,440 and the 100-hourly Simple Moving Average.
  • There is a key bullish trend line forming with support near $2,455 on the hourly chart of ETH/USD (data feed via Kraken).
  • The pair must gain bullish momentum above the $2,520 and $2,550 resistance levels.

Ethereum Price Regains Traction

Ethereum price formed a base above the $2,350 level and started a fresh increase. ETH cleared the $2,420 and $2,450 resistance levels to move into a positive zone, beating Bitcoin.

The bulls even pushed the price above the $2,500 level. A high was formed at $2,518 and the price is now consolidating gains. The price is stable above the 23.6% Fib retracement level of the upward move from the $2,436 swing low to the $2,518 high.

Ethereum price is now trading above $2,450 and the 100-hourly Simple Moving Average. There is also a key bullish trend line forming with support near $2,455 on the hourly chart of ETH/USD.

Ethereum Price
Source: ETHUSD on TradingView.com

On the upside, the price seems to be facing hurdles near the $2,520 level. The first major resistance is near the $2,550 level. A clear move above the $2,550 resistance might send the price toward the $2,580 resistance. An upside break above the $2,580 resistance might call for more gains in the coming sessions. In the stated case, Ether could rise toward the $2,620 resistance zone in the near term. The next hurdle sits near the $2,650 level or $2,720.

Another Pullback In ETH?

If Ethereum fails to clear the $2,520 resistance, it could start another decline. Initial support on the downside is near the $2,480 level. The first major support sits near the $2,455 zone and the trend line or the 76.4% Fib retracement level of the upward move from the $2,436 swing low to the $2,518 high.

A clear move below the $2,435 support might push the price toward $2,420. Any more losses might send the price toward the $2,350 support level in the near term. The next key support sits at $2,250.

Technical Indicators

Hourly MACDThe MACD for ETH/USD is gaining momentum in the bullish zone.

Hourly RSIThe RSI for ETH/USD is now above the 50 zone.

Major Support Level – $2,455

Major Resistance Level – $2,520

Analyst Sets $2.50 Target For SUI Following 30% Weekly Gain – Details

Sui (SUI) has been one of the most popular crypto assets of 2024, with notably high market gains and drastic price losses over the year. The altcoin is currently moving sideways following a recent price rally in the last week. As usual, these consolidative movements draw much speculation on the token’s next price action.

SUI To Record ATH At $2.50, Analyst Says

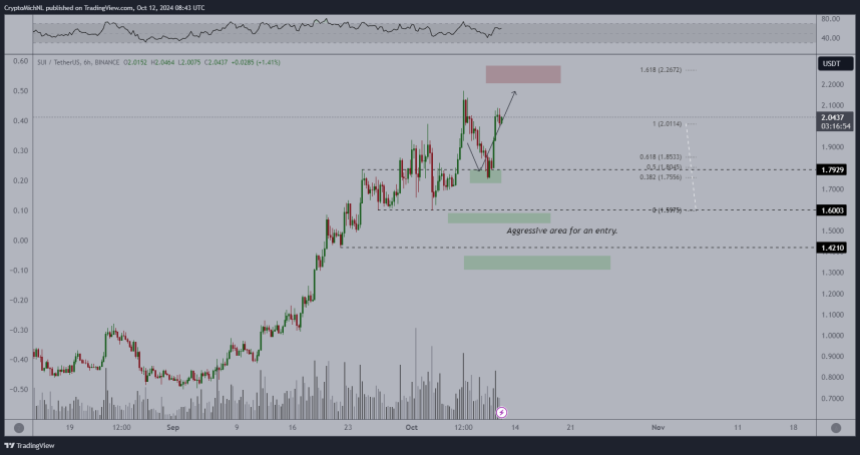
In an X post on Saturday, market analyst Michaël van de Poppe dropped a new price target for SUI based on its current bullish momentum. According to data from CoinMarketCap, SUI recorded a 30.01% profit in the last seven days, emerging as the second-highest weekly gainer in the crypto market. Amidst this price gain, the digital asset already notched a new all-time high of $2.28. However, Van de Poppe’s forecast projects the altcoin to maintain its current uptrend and attain a new peak between $2.30 – $2.50.

SUI

However, looking at the SUI daily chart, certain indicators present an alternative view. For example, the asset’s price is well above its 100-day simple moving average indicating it is potentially overbought and may be due for a price correction. This position is further backed by the token’s RSI  which is well in the overbought zone.

Generally, SUI is one of the best-performing coins of 2024 with an overall price gain of 182.5% since the start of the year. However, it has been a bipolar market experience for the  layer-1 asset which lost about 71.5% of its value between April and August.  

Current market sentiments around the altcoin are largely bullish with investors confident of long-term profitability. Interestingly, SUI has been tipped by analysts to emerge as the diamond of the upcoming bull season with the potential to replicate Solana’s performance in 2021. If this projection proves true, it could rise as high as $70 over the next 12-18 months.

Open Interest Reaches $664 Million 

In tandem with the recent price growth, the Open Interest on SUI has grown by 27.10% in the last 24 hours reaching around $664.29 million. For context, Open Interest measures the value of all active trading positions either long or short in the market.  Interestingly, the daily long/short ratio currently stands at 1.0665, indicating traders are slightly more confident of SUI experiencing a price gain in the future. 

At the time of writing, SUI trades at $2.22 reflecting a 9.62% gain in the last day. Meanwhile, the token’s daily trading volume is up by 12.55% and is valued at 1.12 billion. 

SUI

Expert Dissects $60 Forecast For XRP Price

Este artículo también está disponible en español.

A particular crypto analyst has boldly predicted that XRP price could rise to $60, driven by the influx of demand and capital from institutional investors as it taps into the market share or daily volume of the SWIFT, a global messaging solution for banking and payment. 

Related Reading

XRP Eyes $60 With SWIFT’s Volume Boost

In a recent X (formerly Twitter) post, Levi Rietveld proposed a unique scenario where XRP’s price could potentially surge to $60, marking a staggering increase of approximately 11,220% from its current value of $0.53. Firstly, Rietveld referred to a 2017 paper indicating SWIFT’s daily payment processes. 

According to the paper, SWIFT typically manages about $5 trillion in daily transactions, accumulating to $1.25 quadrillion every year. Based on current market changes and more adoption of the network, the analyst suggested that the figure will likely rise in 2024. He disclosed that SWIFT’s daily transactions have possibly increased to $7 trillion, equating to $1.8 quadrillion annually. 

The analyst also noted that SWIFT’s payment message volumes are usually about 11.5 million daily, with an average payment size of around $45,000. Moreover, he reveals that the current average payment size has increased to $60,000 per transaction, highlighting the staggering amount of fees it takes to execute just one transaction.  

Taking these figures into consideration, Rietveld has hypothesized that if XRP can acquire just 10% of SWIFT’s overall market share, the cryptocurrency could see an “astronomical” increase in its price. Starting on a more conservative estimate, the analyst revealed that with a 5% market share which is about $239.4 billion in daily volume, XRP could see a 1,252.5X increase. This is equivalent to a 9,080.6% surge in XRP, pushing its value to new all time highs at $26.62. 

XRP market cap currently at $30.6 billion. Chart: TradingView

Rietveld further estimated that with a 10% market share, XRP’s price could rise to $52, and even surpass $200 with 20% of SWIFT’s volume. The analyst has called on crypto investors to begin accumulating XRP, stressing that his ambitious projections for the cryptocurrency are not far-fetched, given its advantages over SWIFT in terms of cost, speed, and reliability. 

Institutional Adoption To Drive XRP Price Even Higher

While hypothesizing the extent of XRP’s price surge with a small percentage of SWIFT’s volume, Rietveld also disclosed that the cryptocurrency could see a massive price increase as adoption from institutional investors skyrockets. The analyst disclosed that the XRP market may undergo a significant supply shock when institutional investors begin accumulating the cryptocurrency. 

Related Reading

He revealed that over time, institutional investors will eventually need to buy XRP from the public supply, as the tokens locked in escrow would not be sufficient to meet demand. Considering XRP’s already limited supply, Rietveld has projected that the potential supply shock would trigger a massive price rally to about $200 in the next 10 years. 

Featured image from Shutterstock, chart from TradingView

Solana Prepares For A 20% Rally – Can SOL Reclaim $176?

Este artículo también está disponible en español.

Solana is currently trading above the $140 mark, showing signs of strength as it prepares for a potential move to higher levels. After a modest 5% pump on Friday, investors and analysts are increasingly optimistic about the direction Solana could take in the coming months. 

One prominent analyst, Carl Runefelt, has shared a technical analysis predicting a 20% surge for SOL in the next few weeks, citing bullish patterns and favorable market conditions. His analysis suggests that Solana could reach $176 by the end of the year if current momentum holds.

Related Reading

However, Solana still faces key resistance levels that could challenge its upward trajectory. Despite the recent surge, some market participants are cautious, given the overall volatility in the crypto space. If Solana manages to maintain its current support and break through resistance, the next few months could be pivotal for the asset’s long-term price action.

Can SOL capitalize on its recent gains and reach new highs, or will it struggle to maintain momentum in the face of market headwinds? Investors are eager to see how this plays out as we approach the end of the year.

Solana Testing Supply Levels

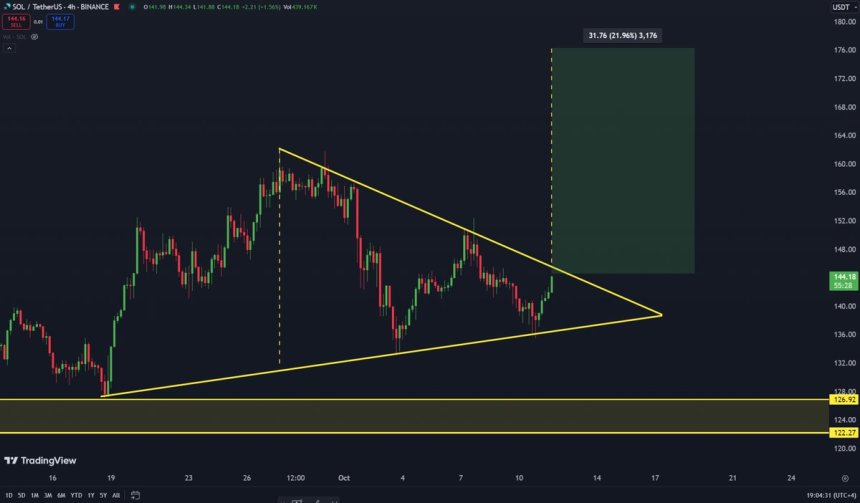
Solana has been trading within a range of $210 to $110 since mid-March, leading to mixed opinions among investors. While some see this price action as a consolidation phase, others believe it could signal an upcoming breakout. Notably, top analyst and entrepreneur Carl Runefelt recently shared a technical analysis on X, revealing a bullish triangle pattern forming for SOL.

Solana about to break out of the bullish triangle pattern.
Solana about to break out of the bullish triangle pattern. | Source: Carl Runefelt on X

According to Runefelt’s analysis, if Solana breaks out of this triangle pattern, it could experience a sharp upward movement, potentially reaching $176 in the coming weeks. This would represent a significant surge from its current trading levels and a key milestone for SOL. The price has struggled to break through the $160 resistance level since early August, but Runefelt suggests that a breakout from the triangle could push the price well beyond this resistance.

Related Reading

A successful break above these critical levels would mean a 20% surge for Solana, with bullish momentum potentially driving it even higher. Investors are closely watching these movements, as a breakout could signal the end of Solana’s extended sideways trading and mark the start of a new upward trend. If SOL can maintain support and continue this rally, it may soon test new highs and solidify its position as one of the top-performing altcoins.

SOL Technical Analysis: Zones To Watch

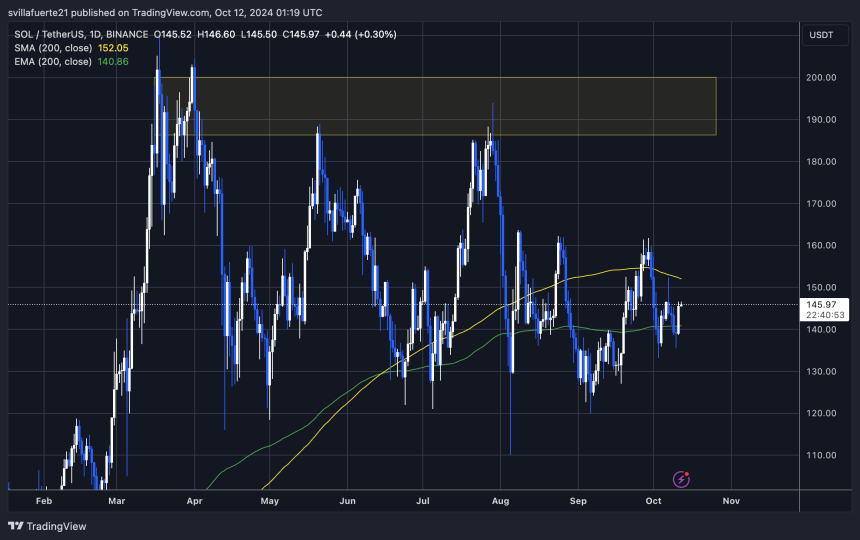
Solana (SOL) is currently trading at $145, following a 7% surge from local lows at $135. The price has managed to rise above the daily 200 exponential moving average (EMA) at $140, a key indicator of short-term trend strength. However, SOL is still 4% away from the crucial 200 moving average (MA) at $152, which represents a stronger, longer-term trend signal.

SOL holding above the 1D 200 EMA.
SOL is holding above the 1D 200 EMA. | Source: SOLUSDT chart on TradingView

A breakout above both the EMA and MA levels is essential for bulls to fully regain control and reclaim the trend. Surpassing these indicators could pave the way for a move to the $160 supply zone, where sellers are expected to be more active. This would signal a continuation of bullish momentum, with potential for further gains.

Related Reading

On the other hand, if the price fails to hold above the $140 mark, this recent surge could be short-lived, and a deeper correction might follow. A break below this level could drive SOL down to $110, which is a significant demand zone that buyers may defend. Traders are keeping a close eye on these levels as the next few days will determine SOL’s s`hort-term direction.

Featured image from Dall-E, chart from TradingView