Spot Ethereum ETFs See $515 Million Record Weekly Inflows – Details

Spot Ethereum ETFs See $515 Million Record Weekly Inflows – Details

The US-based spot Ethereum ETFs have continued to experience a high market interest following Donald Trump’s emergence as the next US President. As institutional investors continue to position themselves for a massive crypto bull run, these Ethereum ETFs have now registered over $500 million in weekly inflows for the first time since their trading debut in July. Meanwhile, the spot Bitcoin ETFs maintain a splendid performance, closing another week with over $1 billion in inflows.

Spot Ethereum ETFs Notch Up $515M Inflows To Extend 3-Week Streak

According to data from ETF aggregator site SoSoValue, the spot Ethereum ETFs attracted $515.17 million between November 9-November 15 to establish a new record weekly inflows, as they achieved a 3-week positive inflow streak for the first time ever.  During this period, these funds also registered their largest daily inflows ever, recording $295.48 million in investments on November 11. 

Of the total market gains in the specified trading week, $287.06 million were directed to BlackRock’s ETHA, allowing the billion-dollar ETF to strengthen its market grip with  $1.72 billion in cumulative net inflow.

Meanwhile, Fidelity’s FETH remained a strong market favorite with $197.75 million in inflows, as its net assets climbed to $764.68 million. Grayscale’s ETH and Bitwise’s ETHW also accounted for weighty investments valued at $78.19 million and $45.54 million, respectively. 

Other ETFs such as VanEck’s ETHV, Invesco’s QETH, and 21 Shares’ CETH experienced some significant inflows but of no more than $3.5 million. With no surprise, Grayscale’s ETHE continues to bleed with $101.02 million recorded in outflows, albeit retains its position as the largest Ethereum ETF with $4.74 billion in AUM. 

In general, the total net assets of the spot Ethereum ETFs also decreased by 1.2% to $9.15 billion representing 2.46% of the Ethereum market cap.

Related Reading: Spot Bitcoin ETFs Draw Over $2 Billion Inflows As Ethereum ETFs Turn Green Again – Details

Spot Bitcoin ETFs Remain Buoyant With $1.67B Inflows

In other news, the spot Bitcoin ETFs market recorded $1.67 billion in the past week to continue its stunning performance of Q4 2024. While the Bitcoin ETFs saw notable daily outflows of over $770 million at the week’s end, earlier weighted inflows of $2.43 billion proved quite significant in maintaining the market’s green momentum. 

BlackRock’s IBIT, which ranks as the market leader and the best-performing crypto spot ETF, now boasts over $29.28 billion in inflows and $42.89 billion in net assets.  Meanwhile, the total net assets of the spot Bitcoin ETF returned to above $95 billion, capturing 5.27% of the Bitcoin market.

At the time of writing, Bitcoin trades at $90,175 with Ethereum hovering around $3,097.

Spot Ethereum ETFs

Shiba Inu On Fire With Over 410 Trillion Tokens Destroyed Amid Burn Rate Growth

They say journalists never truly clock out. But for Christian, that’s not just a metaphor, it’s a lifestyle. By day, he navigates the ever-shifting tides of the cryptocurrency market, wielding words like a seasoned editor and crafting articles that decipher the jargon for the masses. When the PC goes on hibernate mode, however, his pursuits take a more mechanical (and sometimes philosophical) turn.

Christian’s journey with the written word began long before the age of Bitcoin. In the hallowed halls of academia, he honed his craft as a feature writer for his college paper. This early love for storytelling paved the way for a successful stint as an editor at a data engineering firm, where his first-month essay win funded a months-long supply of doggie and kitty treats – a testament to his dedication to his furry companions (more on that later).

Christian then roamed the world of journalism, working at newspapers in Canada and even South Korea. He finally settled down at a local news giant in his hometown in the Philippines for a decade, becoming a total news junkie. But then, something new caught his eye: cryptocurrency. It was like a treasure hunt mixed with storytelling – right up his alley!

So, he landed a killer gig at NewsBTC, where he’s one of the go-to guys for all things crypto. He breaks down this confusing stuff into bite-sized pieces, making it easy for anyone to understand (he salutes his management team for teaching him this skill).

Think Christian’s all work and no play? Not a chance! When he’s not at his computer, you’ll find him indulging his passion for motorbikes. A true gearhead, Christian loves tinkering with his bike and savoring the joy of the open road on his 320-cc Yamaha R3. Once a speed demon who hit 120mph (a feat he vowed never to repeat), he now prefers leisurely rides along the coast, enjoying the wind in his thinning hair.

Speaking of chill, Christian’s got a crew of furry friends waiting for him at home. Two cats and a dog. He swears cats are way smarter than dogs (sorry, Grizzly), but he adores them all anyway. Apparently, watching his pets just chillin’ helps him analyze and write meticulously formatted articles even better.

Here’s the thing about this guy: He works a lot, but he keeps himself fueled by enough coffee to make it through the day – and some seriously delicious (Filipino) food. He says a delectable meal is the secret ingredient to a killer article. And after a long day of crypto crusading, he unwinds with some rum (mixed with milk) while watching slapstick movies.

Looking ahead, Christian sees a bright future with NewsBTC. He says he sees himself privileged to be part of an awesome organization, sharing his expertise and passion with a community he values, and fellow editors – and bosses – he deeply respects.

So, the next time you tread into the world of cryptocurrency, remember the man behind the words – the crypto crusader, the grease monkey, and the feline philosopher, all rolled into one.

Bitcoin Surges Past $93,000 – Can A Breakthrough Unlock New Heights?

Este artículo también está disponible en español.

Bitcoin is on the move again, surging toward its previous high of $93,257 with renewed momentum that has triggered excitement among traders. After a period of consolidation, Bitcoin’s latest price action signals a potential breakout that could set the stage for even greater gains. As it inches closer to this critical resistance level, can the crypto giant break through and unlock new heights, or will the bears reclaim control? With the market’s eyes fixed on this pivotal moment, the next move could reshape BTC’s future.

This analysis aims to explore Bitcoin’s current surge toward the $93,257 resistance level and assess the likelihood of a breakout. By examining key technical indicators and market trends, it seeks to determine whether BTC can overcome this significant hurdle and reach new highs. Additionally, it will explore the possible impact of such a breakthrough on its price trajectory and the broader market sentiment.

Bitcoin’s Renewed Momentum Leading To $93,257

Bitcoin is currently maintaining a bullish stance, holding firmly above the 100-day SMA on the 4-hour chart, a strong indicator of continued upward momentum. The price now aims for its previous high of $93,257, having successfully avoided a drop below the $85,211 support. If this pressure continues, a break above $93,257 could create a path for new highs, while holding above the $85,211 support level signals strength in the ongoing rally.

Bitcoin
BTC showing strength above the 100-day SMA | Source: BTCUSDT on Tradingview.com

An analysis of the 4-hour Relative Strength Index (RSI) shows a continued upside movement as the RSI climbs to 61% after dipping to 53%, signaling that the market is maintaining its bullish strength. Significantly, the sustained rise in the RSI suggests that the uptrend is gaining traction with the potential for more price increases as the buying pressure builds.

Related Reading

Additionally, the daily chart reveals that BTC is experiencing strong upbeat momentum, highlighted by the formation of bullish candlesticks. The asset’s position well above the key 100-day SMA further reinforces this positive trend. As BTC maintains its current trajectory, it bolsters market optimism, setting the stage for additional gains as it aims for the $93,257 target.

Bitcoin
BTC resumes uptrend with the $93,257 target in sight | Source: BTCUSDT on Tradingview.com

Lastly, the RSI on the daily chart is at 92%, indicating strong positive movement after recovering from a dip to 77% suggesting a shift in market sentiment with increased buying pressure. While the high RSI points to continued growth, prolonged overbought conditions may lead to a correction if buying activity begins to wane.

Key Resistance: Can Bitcoin Push Through?

Bitcoin is approaching a critical resistance level at $93,257, a price point that could determine the next phase of its bullish trajectory. If Bitcoin successfully surpasses $93,257, it could pave the way for new highs, indicating continued strength in the market.

Related Reading

However, if the resistance holds, Bitcoin could experience a pullback or consolidation, with the price retracing toward the $83,211 support level. A break below this support could indicate more declines, with the possibility of testing additional key support zones.

Bitcoin
BTC trading at $91,281 on the 1D chart | Source: BTCUSDT on Tradingview.com

Featured image from iStock, chart from Tradingview.com

Bitcoin Exchange Reserves Hit 5-Year Low—What Does This Signal?

The Bitcoin market appears to have taken an intriguing turn as the asset’s reserves on centralized exchanges have hit the lowest levels since November 2018.

This development, highlighted by a CryptoQuant analyst known as G a a h, points out a notable change in BTC’s investor behavior within the crypto space and also suggests quite an interesting trend for Bitcoin.

Bitcoin Reserves On Exchanges Reach Five-Year Low

According to the analyst, Bitcoin reserves on exchanges have diminished significantly throughout 2024, reflecting a shift towards long-term holding strategies among market participants.

Bitcoin (BTC) exchange reserve.

This trend suggests that investors increasingly transfer their assets to private wallets, reducing the supply available for immediate sale and contributing to buying pressure in a market already constrained by supply.

According to G a a h, this behavior indicates a broader sentiment shift, with market participants displaying increased confidence in Bitcoin as a store of value amidst “economic uncertainty and rising inflation.”

By moving Bitcoin away from exchanges, investors reduce the likelihood of sudden sell-offs, which can lead to increased price stability. However, the reduced supply on exchanges may also lead to heightened volatility, especially if demand continues to grow or remains consistent.

The CryptoQuant analyst noted:

With that said, this scenario signals a potentially more volatile but more resilient Bitcoin market, with less selling pressure and a growing dominance of long-term holders, which could open up space for new price peaks.

BTC’s Upward Momentum Cools Off

Following an all-time high (ATH) of $93,477 on Wednesday, November 13, BTC has faced quite a noticeable correction, now down by 4% from this peak. So far, the asset has been unable to continue its upward momentum and appears to be seeing more sell-offs.

Bitcoin (BTC) price chart on TradingView

When writing, Bitcoin trades below $90,000 with a current trading price of $89,779, down by 1.4% in the past day. This price decline resulted in roughly $49 billion subtracted from its market capitalization valuation on Wednesday.

For context, as of today, BTC’s market cap sits at $1.775 trillion, a nearly 5% decrease from the $1.835 trillion valuation two days ago. Bitcoin’s daily trading volume dropped from over $100 billion earlier this week to below $85 billion.

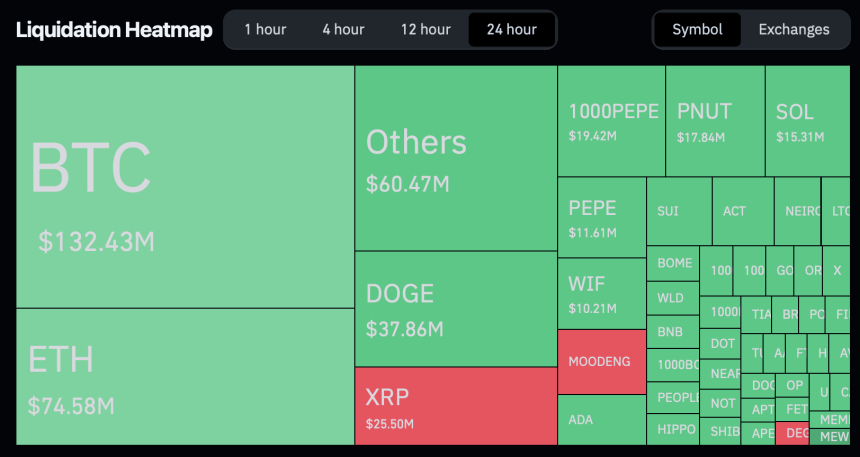
Besides the implications on its market cap and trading volume, BTC’s decline has significantly impacted a handful of traders. According to data from Coinglass, in the past 24 hours alone, roughly 170,215 traders have been liquidated, bringing the total liquidations in the crypto market to $510.13 million.

Total liquidation in the crypto market

Out of these total liquidations, Bitcoin accounts for $132.43 million, with the majority of the liquidations coming from long positions—those who bet that the upward momentum would continue.

Featured image created with DALL-E, Chart from TradingView

Major Hindrances To Dogecoin Price Hitting $1 According To This Crypto Analyst

Este artículo también está disponible en español.

A crypto analyst, identified as ‘Trading Jesus’ on X (formerly Twitter), unveiled the roadmap for the Dogecoin price to reach $1. By highlighting Dogecoin’s resistance and support levels, the analyst has underscored the major hindrance to the meme coin hitting the $1 milestone

Dogecoin Price Roadmap To The $1 Target

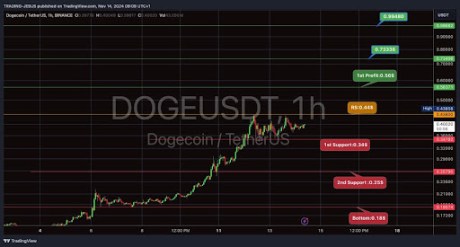
In his X post, Trading Jesus shared a Dogecoin chart on the 1-hour timeframe showing the support and resistance levels as the Dogecoin price aims for the $1 mark. Currently trading at $0.36, the crypto analyst has indicated that the next resistance level for Dogecoin is $0.44. 

Related Reading

Dogecoin price $1
Source: X

This crucial level could trigger major selling pressures for the meme coin as investors start liquidating their holdings. However, if Dogecoin can successfully break above the $0.44 level, the meme coin could enter a bullish phase, with its next price high at around $0.56. 

Trading Jesus has highlighted the $0.56 price increase as a profit-taking level at which traders and investors could begin selling their Dogecoin for potential gains. The analyst has also pinpointed a higher resistance level at $0.73336 if Dogecoin can maintain its bullish momentum above that level. 

At the $0.73336 resistance level, Trading Jesus has predicted that Dogecoin could see its price surging to the highly coveted $1 milestone. His chart revealed Dogecoin’s next bullish target to be $0.996 if its price continues increasing. 

On the flip side, Trading Jesus has also shown the support levels for Dogecoin if it fails to break past key resistance levels. The first support at $0.34 represents a crucial level where buyers might step in if the price of Dogecoin drops. This support level ultimately acts as a barrier to prevent more price drops.

If Dogecoin declines below the $0.34 support level, the cryptocurrency could experience further downward pressure, leading to a drop towards the $0.25 mark. If more pullbacks occur, Trading Jesus has revealed that the Dogecoin price could bottom to new lows around the $0.18 level. 

Analyst Remains Bullish Despite DOGE’s 8% Price Decline

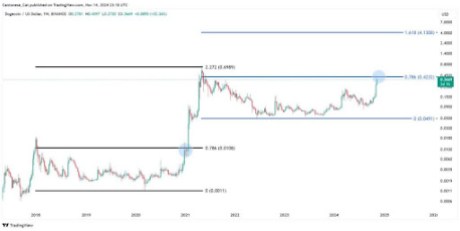
While analysts foresee the Dogecoin price hitting $1, others have predicted even higher all-time highs for the popular meme coin. A crypto analyst known as the ‘Cantonese Cat’ on X has unveiled a weekly DOGE price chart projecting a potential leap to $4. 

Related Reading

Dogecoin price $1 2
Source: X

In the chart, the analyst indicated that Dogecoin is on its way to hitting the $0.42 price level at the 0.786 Fibonacci level. Breaking past this level could trigger a surge towards the 1.618 Fib, representing a price increase above $4.0.

The Cantonese cat has revealed that investors and traders likely have three to four weeks to accumulate at Dogecoin’s current price of $0.36 before it shoots up to $4. 

Dogecoin price chart from Tradingview.com
DOGE price looking at reversal | Source: DOGEUSDT on Tradingview.com

Featured image created with Dall.E, chart from Tradingview.com

Why Memecoin Frenzy Is Bad For Bitcoin

Este artículo también está disponible en español.

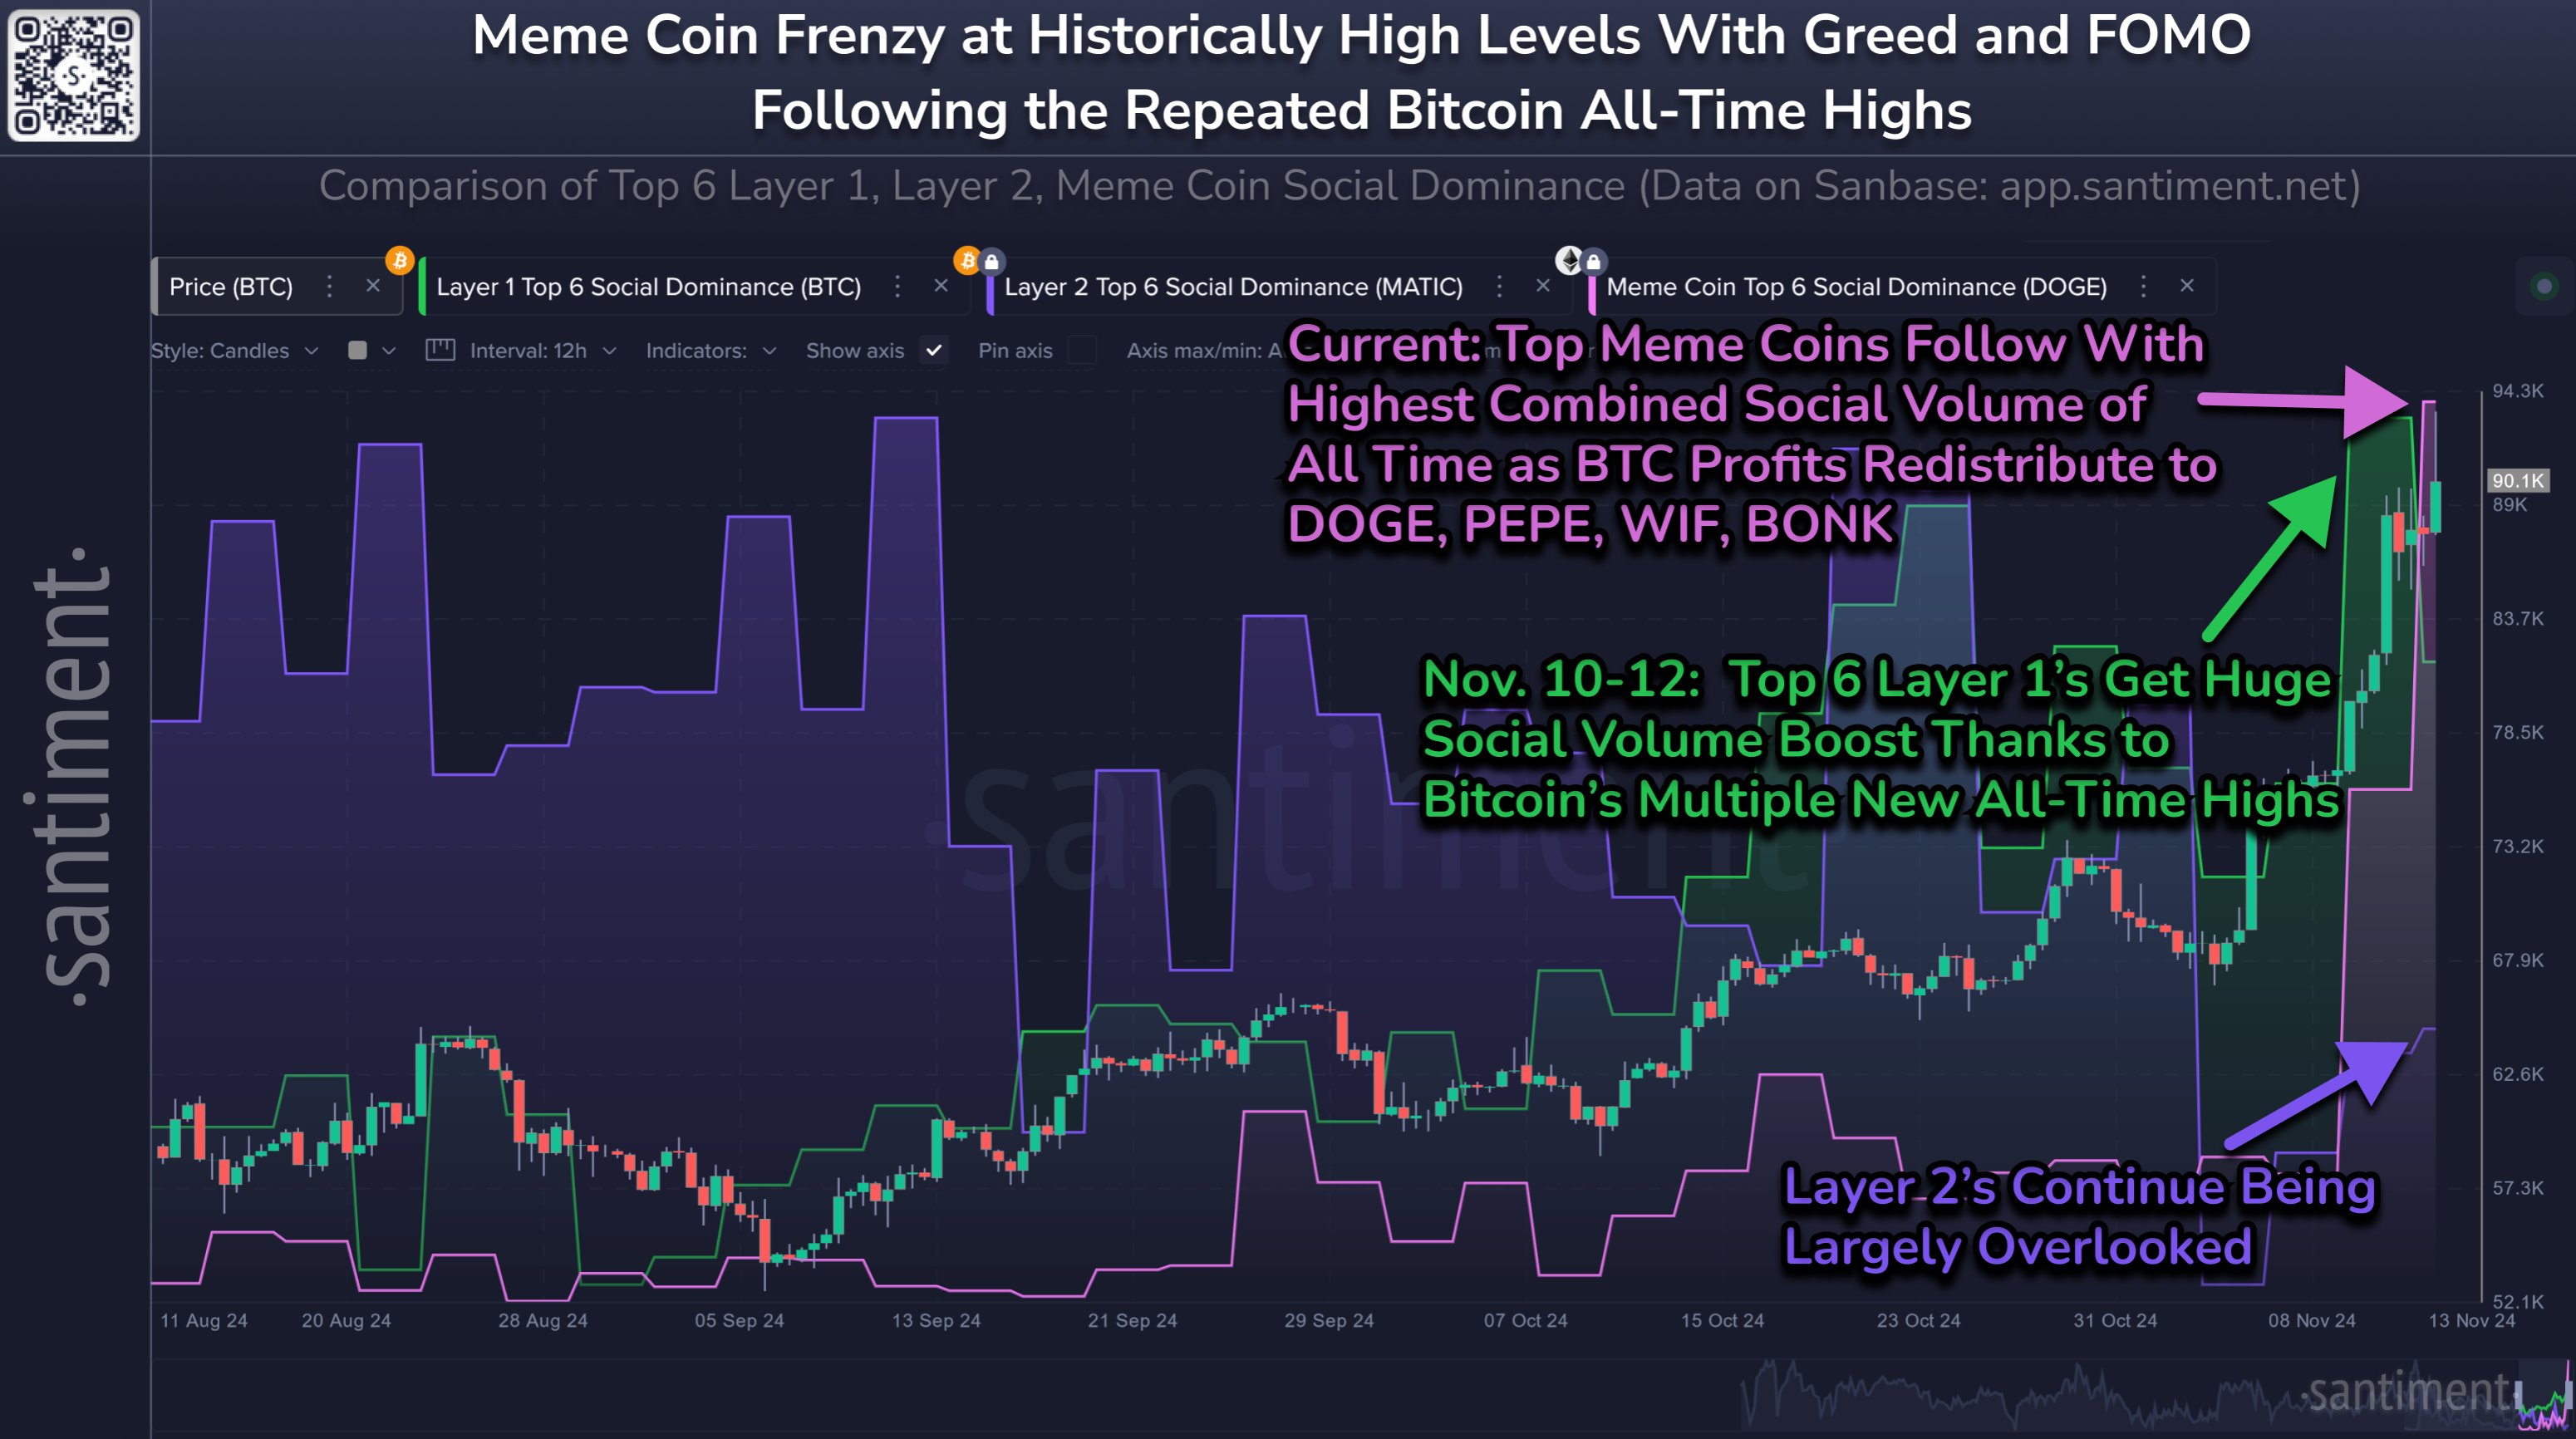
Data shows Dogecoin and other meme coins are receiving a significant amount of attention on social media, a sign that may not be ideal for Bitcoin.

Top 6 Memecoins Have Seen Their Social Dominance Rocket Up Recently

In a new post on X, the analytics firm Santiment has discussed about the trend in the Social Dominance for a few different subsections of the cryptocurrency sector.

The “Social Dominance” here refers to an indicator that basically tells us about the mindshare that a particular asset or a group of coins has on the major social media platforms right now.

Related Reading

More formally, the metric’s value is calculated as a percentage of the discussions related to the top 100 cryptocurrencies by market cap that the given asset is making up for.

To determine this, the indicator collects posts/threads/messages available on five platforms: X, Reddit, Telegram, 4Chan, and BitcoinTalk. It then filters them for the keyword in question.

Note that for measuring the “discussion,” the metric simply counts up these posts containing at least one mention of the asset, rather than counting up the mentions themselves. The advantage of this methodology is that outlier posts containing hundreds of mentions don’t skew the data.

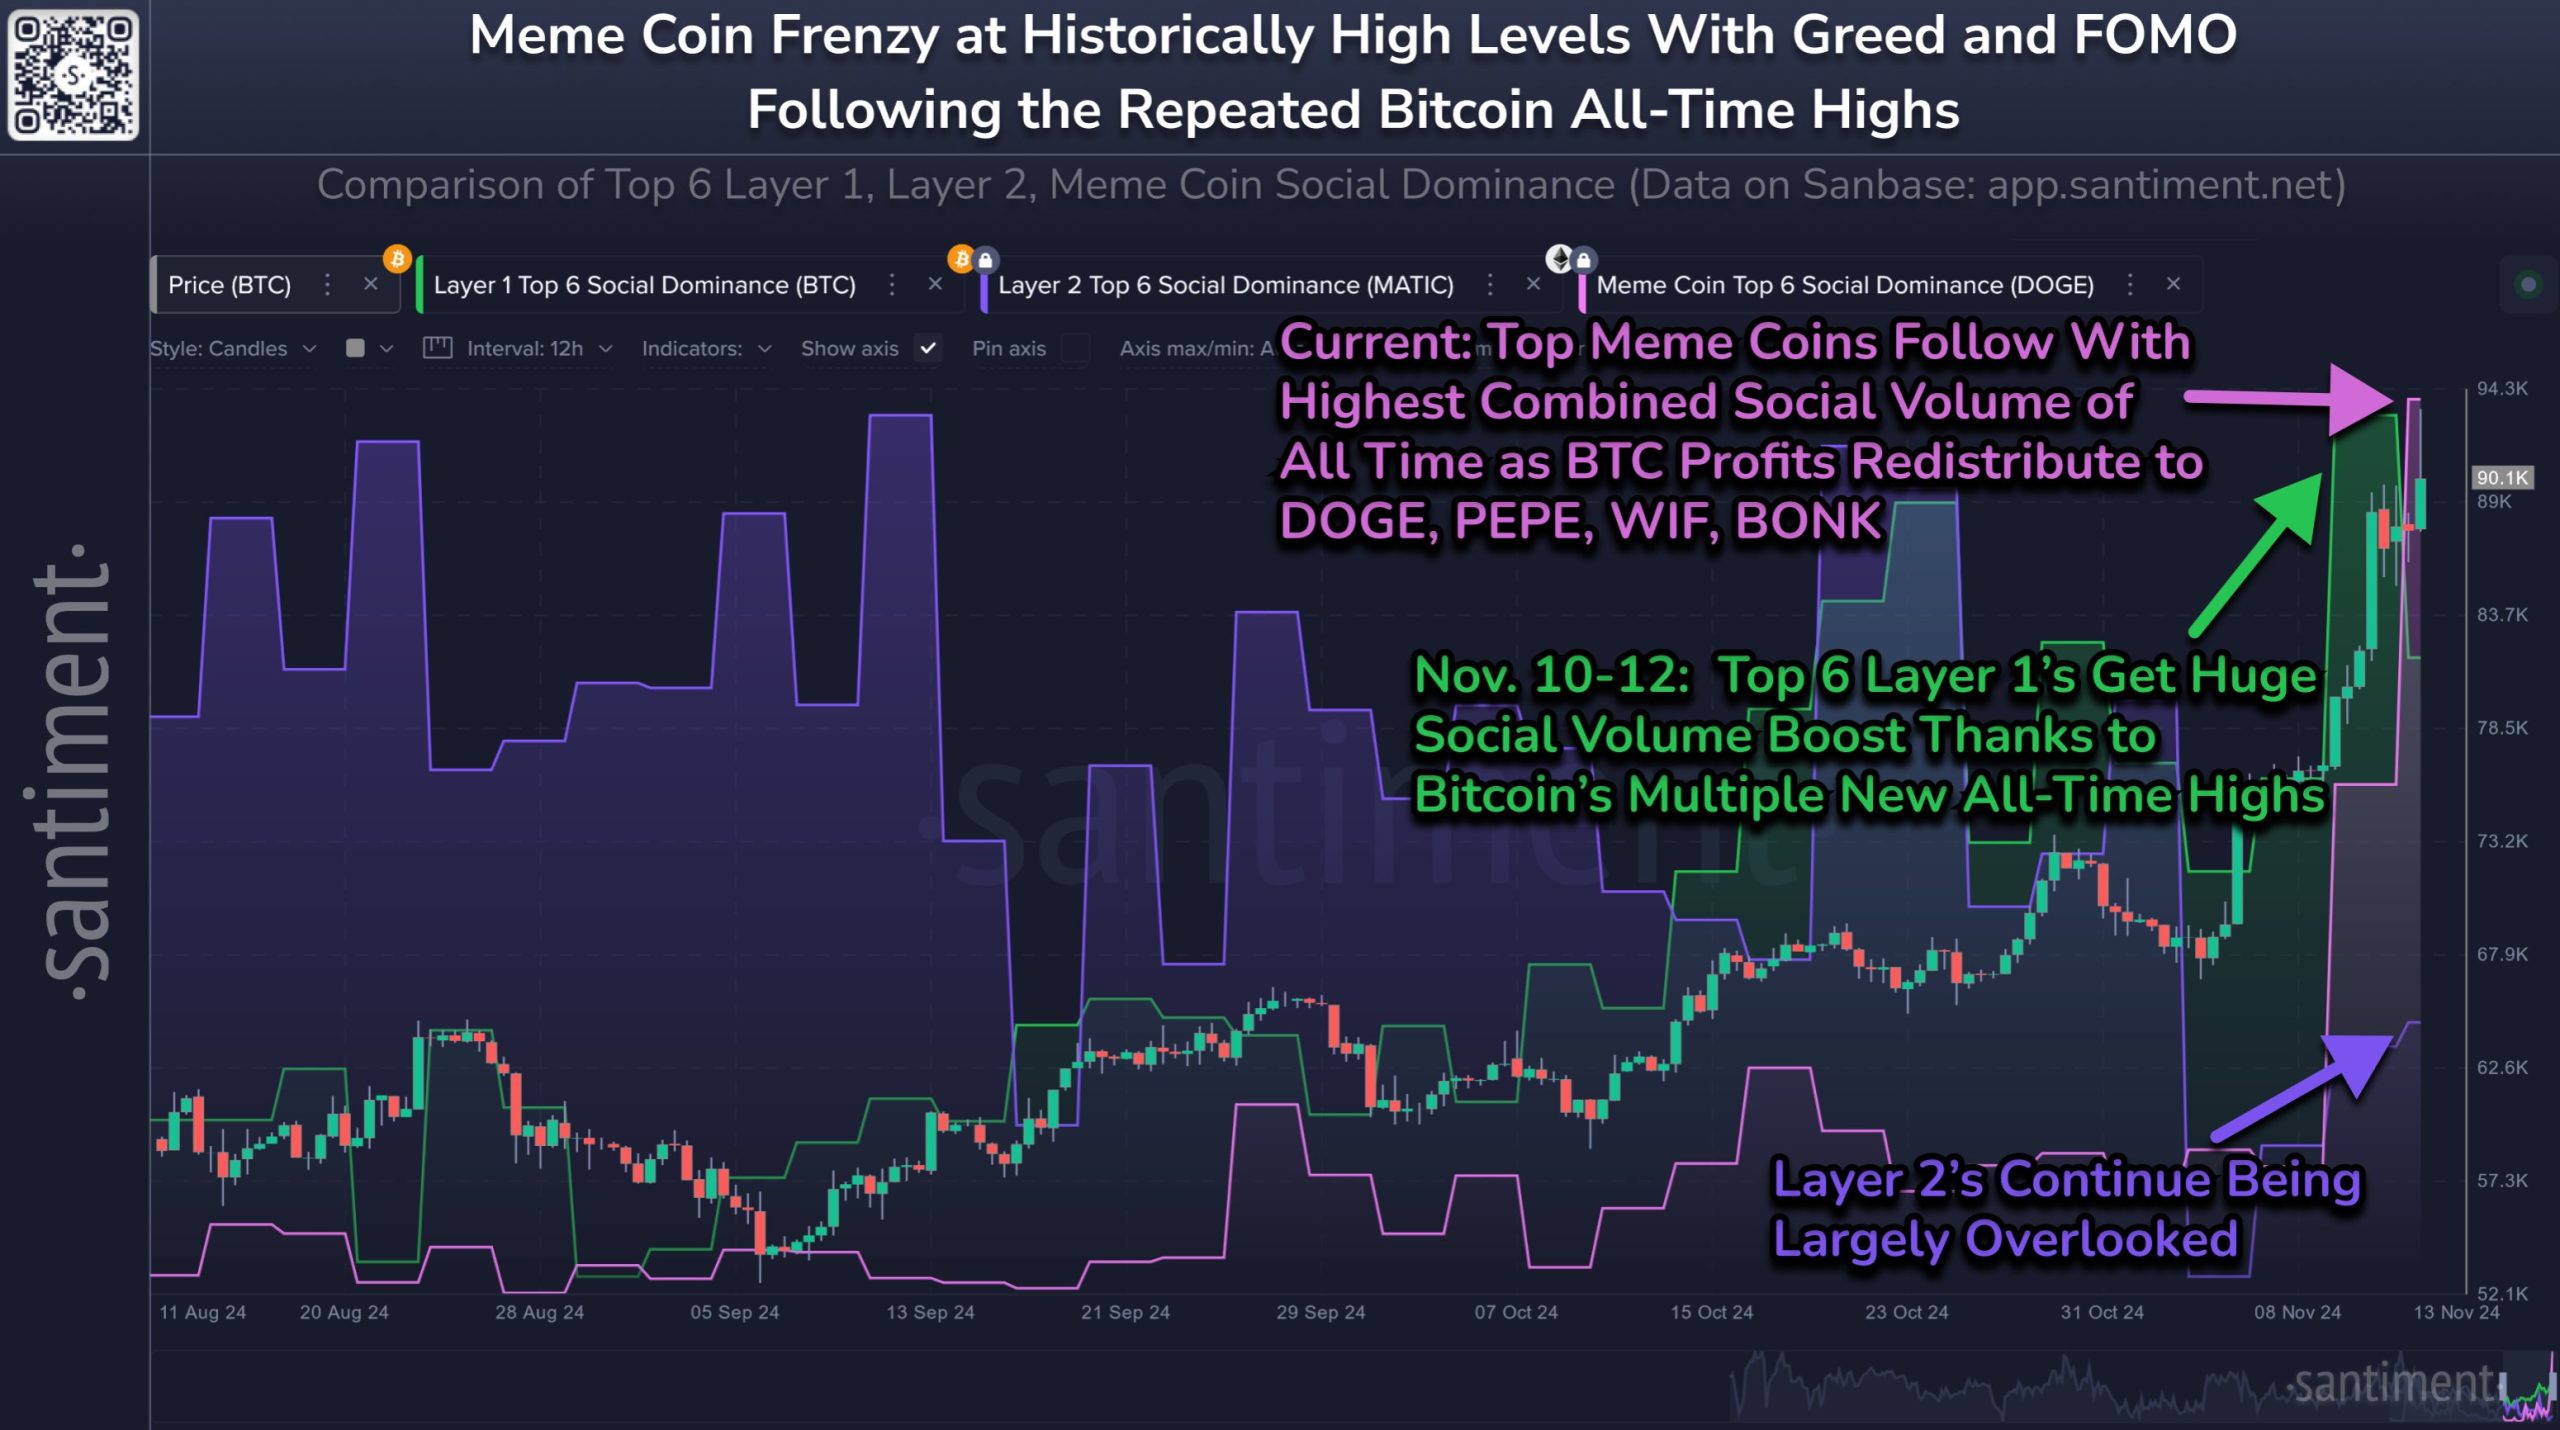
Now, here is the chart shared by the analytics firm that shows how the Social Dominance related to three subsections of the market has changed over the last few months:

Dogecoin vs Bitcoin Social Dominance
The value of the metric appears to have surged for Dogecoin and other meme coins recently | Source: Santiment on X

The three segments in question are the layer 1 top six, the layer 2 top six, and the memecoin top 6. “Layer 1” networks refer to the primary blockchains that handle their own security, like Bitcoin and Ethereum. Networks like Polygon that are built on top of these chains are known as “layer 2.” Naturally, the meme coins refer to the popular meme-based tokens, like Dogecoin and Shiba Inu.

From the graph, it’s apparent that the Social Dominance of the layer 1 top 6 had rocketed up a couple of days back as a result of Bitcoin setting multiple new all-time highs (ATHs).

BTC has continued to explore new highs since then, but it appears that the focus of social media users has shifted elsewhere, with the Social Dominance of the layer 1 giants witnessing a cooldown.

The indicator has stayed relatively low for the layer 2 coins throughout this, implying the traders haven’t been caring much about them recently. The assets that have hogged all the attention have been the memecoins, who have just seen their discussion hit a new record.

The reason behind this high interest in these tokens is the impressive rally that Dogecoin has seen over the past week, leaving the rest of the sector in the dust after amassing profits of more than 104%. If the past is anything to go by, though, this outperformance may not be such a good thing.

“Historically high speculative asset social dominance typically indicates greed and emotional trading,” notes Santiment. Assets in the cryptocurrency sector tend to move opposite to the crowd’s beliefs, so greed is something that has generally led to tops for the market.

Related Reading

As such, it’s possible that a shift in focus away from Dogecoin may have to happen, if Bitcoin and others have to continue their bull run.

Dogecoin Price

At the time of writing, Dogecoin is trading around $0.398, up over 2% in the last 24 hours.

Dogecoin Price Chart
The price of the coin appears to have slowed down over the last couple of days | Source: DOGEUSDT on TradingView

Featured image from Dall-E, Santiment.net, chart from TradingView.com

Bitcoin Price Holds The Line: Is Another Surge Possible?

Este artículo también está disponible en español.

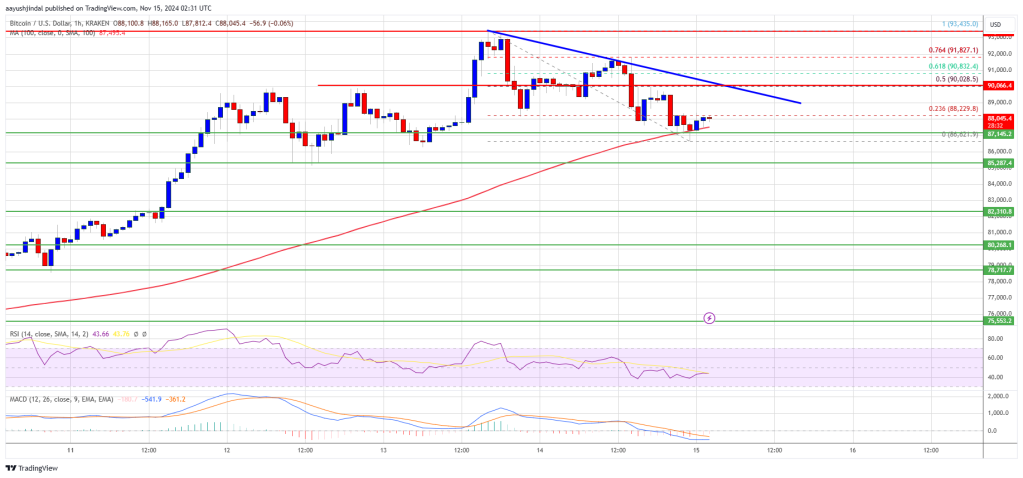
Bitcoin price saw a short-term correction from the $93,450 zone. BTC is now consolidating gains near $87,000 and might attempt another increase in the near term.

  • Bitcoin started a downside correction from the $93,450 zone.
  • The price is trading above $87,000 and the 100 hourly Simple moving average.
  • There is a connecting bearish trend line forming with resistance at $90,000 on the hourly chart of the BTC/USD pair (data feed from Kraken).
  • The pair could start a fresh increase if it stays above the $87,000 zone.

Bitcoin Price Starts Downside Correction

Bitcoin price attempted more gains above the $93,000 level. BTC traded to a new all-time high at $93,435 and recently started a short-term downside correction.

There was a minor decline below the $90,000 level. The price even dipped below the $88,000 level. A low was formed at $86,621 and the price is now consolidating. It is slowly moving higher and trading near the 23.6% Fib retracement level of the downward move from the $93,435 swing high to the $86,621 low.

Bitcoin price is now trading above $87,000 and the 100 hourly Simple moving average. On the upside, the price could face resistance near the $90,000 level. There is also a connecting bearish trend line forming with resistance at $90,000 on the hourly chart of the BTC/USD pair.

The trend line is close to the 50% Fib retracement level of the downward move from the $93,435 swing high to the $86,621 low. The first key resistance is near the $90,850 level. A clear move above the $90,850 resistance might send the price higher.

Bitcoin Price
Source: BTCUSD on TradingView.com

The next key resistance could be $91,500. A close above the $91,500 resistance might initiate more gains. In the stated case, the price could rise and test the $93,450 resistance level. Any more gains might send the price toward the $95,000 resistance level.

More Downsides In BTC?

If Bitcoin fails to rise above the $90,000 resistance zone, it could start a downside correction. Immediate support on the downside is near the $87,150 level.

The first major support is near the $86,500 level. The next support is now near the $85,280 zone. Any more losses might send the price toward the $82,500 support in the near term.

Technical indicators:

Hourly MACD – The MACD is now losing pace in the bearish zone.

Hourly RSI (Relative Strength Index) – The RSI for BTC/USD is now below the 80 level.

Major Support Levels – $87,150, followed by $86,500.

Major Resistance Levels – $90,000, and $91,500.

‘Kimchi Premium’ Returns Amid Rally

Rubmar is a writer and translator who has been a crypto enthusiast for the past four years. Her goal as a writer is to create informative, complete, and easily understandable pieces accessible to those entering the crypto space. After learning about cryptocurrencies in 2019, Rubmar became curious about the world of possibilities the industry offered, quickly learning that financial freedom was at the palm of her hand with the developing technology.

From a young age, Rubmar was curious about how languages work, finding special interest in wordplay and the peculiarities of dialects. Her curiosity grew as she became an avid reader in her teenage years. She explored freedom and new words through her favorite books, which shaped her view of the world. Rubmar acquired the necessary skills for in-depth research and analytical thinking at university, where she studied Literature and Linguistics. Her studies have given her a sharp perspective on several topics and allowed her to turn every stone in her investigations.

In 2019, she first dipped her toes in the crypto industry when a friend introduced her to Bitcoin and cryptocurrencies, but it wasn’t until 2020 that she started to dive into the depth of the industry. As Rubmar began to understand the mechanics of the crypto sphere, she saw a new world yet to be explored.

At the beginning of her crypto voyage, she discovered a new system that allowed her to have control over her finances. As a young adult of the 21st century, Rubmar has faced the challenges of the traditional banking system and the restrictions of fiat money.

After the failure of her home country’s economy, the limitations of traditional finances became clear. The bureaucratic, outdated structure made her feel hopeless and powerless amid an aggressive and distorted system created by hyperinflation. However, learning about decentralization and self-custody opened a realm of opportunities. Cryptocurrencies allowed her to experience financial control for the first time and expand her financial education.

Moreover, the peculiar nature of the crypto community sparked Rubmar’s curiosity about the other layers of the industry. As a result, she found a particular interest in discovering the diverse perspectives of investors, market watchers, experts, and developers. Her attempts to better understand the crypto space made her realize the strong links of the community with other industries, enriching her perspective of the sector. As someone who spends most of her day online, Rubmar enjoys finding the points where the crypto world meets with her other passions and hobbies ­–or her favorite memes.

In her free time, she usually finds joy in different art forms. As a child, she enlisted in every extra-curricular activity in her hometown, including music classes, dancing, jewelry making, and the local chorus. Despite her many attempts to learn different instruments, Rubmar only knows how to play the xylophone, which she played for 7 years in her school’s marching band.

She also has a passion for learning new languages and cultures, having set the goal to learn another six languages ­– currently attempting to learn Italian and Korean. Scrapbooking, paper crafting, and bookbinding are her biggest interests outside of work, constantly taking classes and attending workshops to learn new techniques. The rest of her free time is spent stressing over football matches and transfer market news or feeding cats –hers or stray.

In summary, Rubmar seeks to present entertaining and educational pieces to be enjoyed by everybody, aiming to report on the latest news and offer a unique perspective while adding a meme or a pun whenever possible.

Analysts Say It’s Behaving ‘As Predicted’

Este artículo también está disponible en español.

Crypto analysts said that Bitcoin remains on course for a massive price hike after Donald Trump reclaimed the US presidency through a historic win against US Vice President Kamala Harris.

Related Reading

Bitcoin’s price trajectory has been the subject of many speculations in the last few weeks but with the election of a known pro-crypto candidate, it seems BTC is moving in the upward direction.

At the time of writing, BItcoin was trading at $76,033, up 1.7% and 9.5% in the daily and weekly timeframes, data from Coingecko shows. The figure marks bitcoin new all-time high.

Bitcoin: $85,000 Feasible?

A prominent crypto analyst suggested that Bitcoin will soon reach $85,000, claiming that the price surge will be fueled by Trump’s return to the White House.

In a post, Ali Martinez said that the firstborn cryptocurrency is “playing as predicted.” Martinez predicted that Bitcoin would hit $78,000 but would fall to $71,500 before soaring to an all-time high of $85,000.

Martinez assured that despite the coin experiencing brief pullbacks, BTC’s price trajectory remains on track, noting the coin’s price stabilized at $74,812 after reaching an all-time record of $76,493.

In an earlier post, Martinez has already stated that Bitcoin is “going according to plan.” He said that BTC will increase to $72,000, and then go down to $69,000 before skyrocketing to $78,000.

BTC’s Uptrend

Another market observer predicted that there is a high likelihood that Bitcoin will increase by 30% to 40% but he does not see that the crypto will repeat the 368% hike which occurred in previous cycles.

BTCUSD trading at $75,885 on the daily chart: TradingView.com

Ki Young Ju of CryptoQuant made the prediction after BTC hit $75,000 which he believed was influenced greatly by the results of the US election.

Ju explained that it triggered the price rally to reach that level, further positioning Bitcoin as one of the largest financial assets in terms of market capitalization.

Ju urged investors for subtle profit-taking during the “max pain” phases which are essential to understand the market dynamics of BTC.

He said that Bitcoin follows a cyclical nature, explaining that new traders usually endure losses when the market is bearish. After two years, investors see their digital assets change hands when the “max pain” phase dies down.

According to him, BTC’s current market environment matched well with an easing period.

Related Reading

Potential Cooling Off

However, some analysts projected a possible cooling off for BTC coming after the recent price hike, saying that it has breached the upper Bollinger Band serving as a cue for overbought conditions.

They suggested that there could be increasing pressure to sell and profit-taking because of the emergence of red candlestick formations.

BTC used to be in the overbought zone or a score above 70 in the Relative Strength Index (RSI) chart but now, it has retreated to 67.34, indicating “a loss of bullish momentum” and a potential price correction.

Featured image from StormGain, chart from TradingView


Ethereum Price Rise Targets $3,000: Will It Cross the Mark?

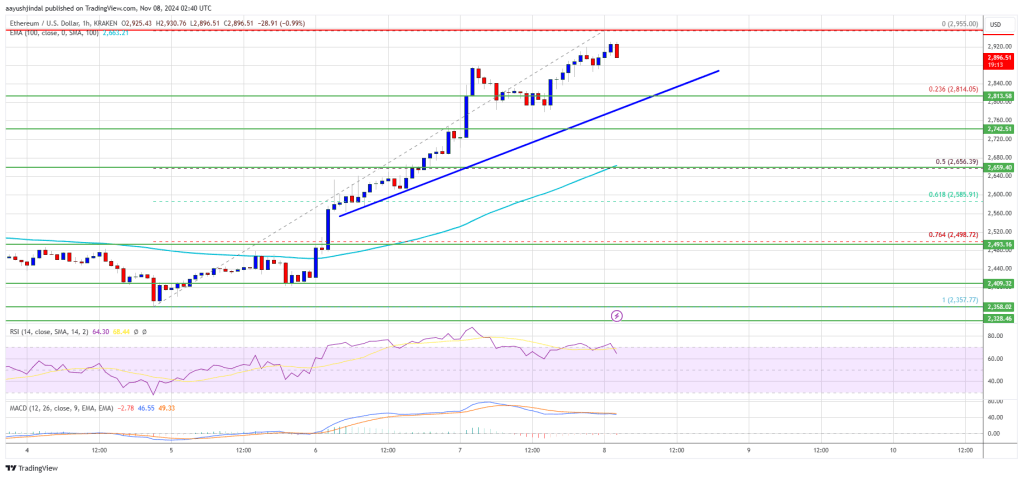
Ethereum price started a fresh increase above the $2,720 resistance. ETH is up over 10% and now approaches the key barrier at $3,000.

  • Ethereum started a fresh surge above the $2,720 resistance zone.
  • The price is trading above $2,750 and the 100-hourly Simple Moving Average.
  • There is a new connecting bullish trend line forming with support at $2,820 on the hourly chart of ETH/USD (data feed via Kraken).
  • The pair could continue to rise if it clears the $2,950 resistance.

Ethereum Price Extends Its Increase

Ethereum price started a fresh increase above the $2,650 resistance like Bitcoin. ETH was able to climb above the $2,720 and $2,750 resistance levels to move further into a positive zone.

It even surged above the $2,850 level in the past few sessions, beating BTC. It is up over 10% and there was a move above $2,920. A high is formed at $2,955 and the price is showing signs of more upsides. It is well above the 23.6% Fib retracement level of the upward move from the $2,355 swing low to the $2,955 high.

Ethereum price is now trading above $2,800 and the 100-hourly Simple Moving Average. There is also a connecting bullish trend line forming with support at $2,820 on the hourly chart of ETH/USD.

On the upside, the price seems to be facing hurdles near the $2,920 level. The first major resistance is near the $2,950 level. The main resistance is now forming near $3,000. A clear move above the $3,000 resistance might send the price toward the $3,120 resistance.

Ethereum Price

An upside break above the $3,120 resistance might call for more gains in the coming sessions. In the stated case, Ether could rise toward the $3,250 resistance zone.

Are Dips Limited In ETH?

If Ethereum fails to clear the $2,950 resistance, it could start a downside correction. Initial support on the downside is near the $2,850 level. The first major support sits near the $2,820 zone and the trend line.

A clear move below the $2,820 support might push the price toward $2,720. Any more losses might send the price toward the $2,650 support level in the near term. The next key support sits at $2,550.

Technical Indicators

Hourly MACDThe MACD for ETH/USD is gaining momentum in the bullish zone.

Hourly RSIThe RSI for ETH/USD is now above the 50 zone.

Major Support Level – $2,820

Major Resistance Level – $2,950