Ethereum Price Rise Targets $3,000: Will It Cross the Mark?

Ethereum Price Rise Targets $3,000: Will It Cross the Mark?

Ethereum price started a fresh increase above the $2,720 resistance. ETH is up over 10% and now approaches the key barrier at $3,000.

  • Ethereum started a fresh surge above the $2,720 resistance zone.
  • The price is trading above $2,750 and the 100-hourly Simple Moving Average.
  • There is a new connecting bullish trend line forming with support at $2,820 on the hourly chart of ETH/USD (data feed via Kraken).
  • The pair could continue to rise if it clears the $2,950 resistance.

Ethereum Price Extends Its Increase

Ethereum price started a fresh increase above the $2,650 resistance like Bitcoin. ETH was able to climb above the $2,720 and $2,750 resistance levels to move further into a positive zone.

It even surged above the $2,850 level in the past few sessions, beating BTC. It is up over 10% and there was a move above $2,920. A high is formed at $2,955 and the price is showing signs of more upsides. It is well above the 23.6% Fib retracement level of the upward move from the $2,355 swing low to the $2,955 high.

Ethereum price is now trading above $2,800 and the 100-hourly Simple Moving Average. There is also a connecting bullish trend line forming with support at $2,820 on the hourly chart of ETH/USD.

On the upside, the price seems to be facing hurdles near the $2,920 level. The first major resistance is near the $2,950 level. The main resistance is now forming near $3,000. A clear move above the $3,000 resistance might send the price toward the $3,120 resistance.
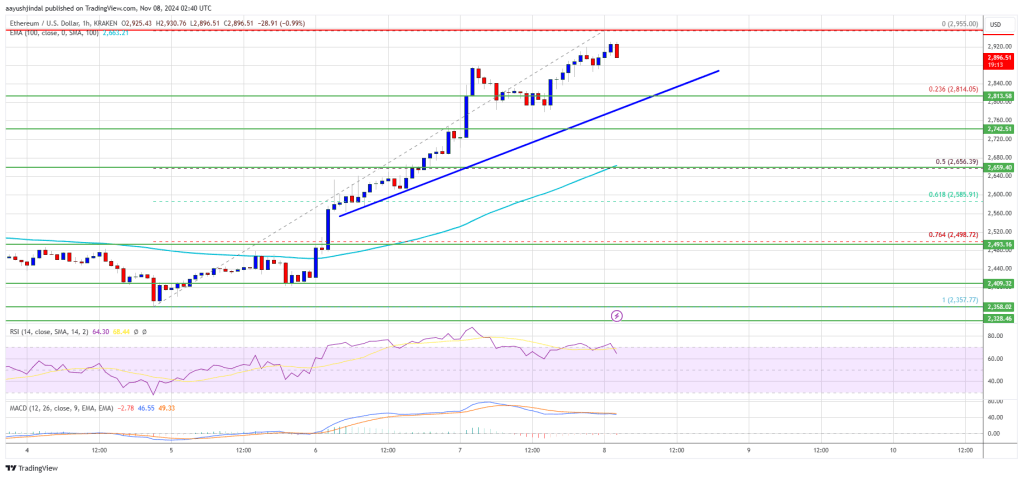
Ethereum Price

An upside break above the $3,120 resistance might call for more gains in the coming sessions. In the stated case, Ether could rise toward the $3,250 resistance zone.

Are Dips Limited In ETH?

If Ethereum fails to clear the $2,950 resistance, it could start a downside correction. Initial support on the downside is near the $2,850 level. The first major support sits near the $2,820 zone and the trend line.

A clear move below the $2,820 support might push the price toward $2,720. Any more losses might send the price toward the $2,650 support level in the near term. The next key support sits at $2,550.

Technical Indicators

Hourly MACDThe MACD for ETH/USD is gaining momentum in the bullish zone.

Hourly RSIThe RSI for ETH/USD is now above the 50 zone.

Major Support Level – $2,820

Major Resistance Level – $2,950

Analyst Predicts ‘The Final Ascent’ For Bitcoin Price, Why A Rise To $300,000 Is Possible From Here

Este artículo también está disponible en español.

The Bitcoin price has now returned into a full bullish sentiment now that the crypto fear and greed index has flipped into greed. This shift reflects growing confidence among investors as optimism takes hold in the cryptocurrency market. For many investors, this renewed positive outlook serves as a strong foundation for more gains in the Bitcoin price.

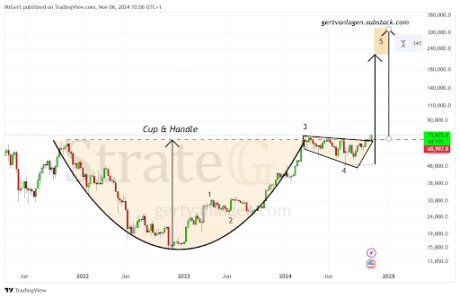
According to a crypto analyst, Bitcoin is ripe for a final ascent to the $300,000 price level. Interestingly, this outlook is not just based on the current bullish sentiment, but the analyst is going off of technical analysis of the current Bitcoin price action.

Final Ascent For Bitcoin Price

Crypto analyst Gert van Lagen took to social media platform X to share an intriguing outlook concerning Bitcoin and its price action this year in light of the recent US presidential elections and its effect of its price. Speaking of an intriguing outlook for the Bitcoin price, analyst van Lagen highlighted that Bitcoin is still on track to reach $250,000 this year. 

Related Reading

His outlook came through a funny poem and a play of words on the Bitcoin price action from August, which he titled “#Bitcoin – The Final Ascent.” The analyst also shared a BTC price chart with technical analysis. 

Central to van Lagen’s analysis is a detailed look at the cup and handle pattern that has been developing in Bitcoin’s price chart since the 2022 bear market. According to his analysis, the ‘cup’ portion of this pattern began forming in early 2022 and eventually concluded with Bitcoin’s surge past its previous 2021 all-time high in March 2024. The subsequent consolidation phase, which lasted until October, represents the ‘handle’ segment of the pattern.

With recent inflows driving Bitcoin to fresh all-time highs, the price has now broken out from the neck of long-standing cup and handle formation, marking the beginning of what van Lagen dubs ‘the final ascent.’ 

Bitcoin price
Source: X

What’s Next For Bitcoin?

The cup and handle pattern is often seen as a bullish continuation signal. Breakouts from this pattern often indicate that the asset is about to experience a massive upward movement.

Related Reading

In the case of the Bitcoin price and its breakout from the cup and handle pattern, Gert van Lagen highlighted a surge to the $300,000 price level. Notably, this outlook is also based on the prediction of a recession in the next six months.

“A warning sign we can’t abide.  For history shows in months but six, Recession strikes—the clock now ticks,” he said.

In terms of a projected timeline, van Lagen expects the Bitcoin price to reach $250,000 and subsequently $300,000 latest by February 25. 

At the time of writing, Bitcoin is trading at $74,845. A surge towards $250,000 and $300,000 will represent 235% and 300% increase, respectively, from the current price level.

Bitcoin price chart from Tradingview.com
BTC price shooting for $75,000 | Source: BTCUSD on Tradingview.com

Featured image created with Dall.E, chart from Tradingview.com

XRP Price Ready to Rally? Signs Point to a Bullish Move

Aayush Jindal, a luminary in the world of financial markets, whose expertise spans over 15 illustrious years in the realms of Forex and cryptocurrency trading. Renowned for his unparalleled proficiency in providing technical analysis, Aayush is a trusted advisor and senior market expert to investors worldwide, guiding them through the intricate landscapes of modern finance with his keen insights and astute chart analysis.

From a young age, Aayush exhibited a natural aptitude for deciphering complex systems and unraveling patterns. Fueled by an insatiable curiosity for understanding market dynamics, he embarked on a journey that would lead him to become one of the foremost authorities in the fields of Forex and crypto trading. With a meticulous eye for detail and an unwavering commitment to excellence, Aayush honed his craft over the years, mastering the art of technical analysis and chart interpretation.
As a software engineer, Aayush harnesses the power of technology to optimize trading strategies and develop innovative solutions for navigating the volatile waters of financial markets. His background in software engineering has equipped him with a unique skill set, enabling him to leverage cutting-edge tools and algorithms to gain a competitive edge in an ever-evolving landscape.

In addition to his roles in finance and technology, Aayush serves as the director of a prestigious IT company, where he spearheads initiatives aimed at driving digital innovation and transformation. Under his visionary leadership, the company has flourished, cementing its position as a leader in the tech industry and paving the way for groundbreaking advancements in software development and IT solutions.

Despite his demanding professional commitments, Aayush is a firm believer in the importance of work-life balance. An avid traveler and adventurer, he finds solace in exploring new destinations, immersing himself in different cultures, and forging lasting memories along the way. Whether he’s trekking through the Himalayas, diving in the azure waters of the Maldives, or experiencing the vibrant energy of bustling metropolises, Aayush embraces every opportunity to broaden his horizons and create unforgettable experiences.

Aayush’s journey to success is marked by a relentless pursuit of excellence and a steadfast commitment to continuous learning and growth. His academic achievements are a testament to his dedication and passion for excellence, having completed his software engineering with honors and excelling in every department.

At his core, Aayush is driven by a profound passion for analyzing markets and uncovering profitable opportunities amidst volatility. Whether he’s poring over price charts, identifying key support and resistance levels, or providing insightful analysis to his clients and followers, Aayush’s unwavering dedication to his craft sets him apart as a true industry leader and a beacon of inspiration to aspiring traders around the globe.

In a world where uncertainty reigns supreme, Aayush Jindal stands as a guiding light, illuminating the path to financial success with his unparalleled expertise, unwavering integrity, and boundless enthusiasm for the markets.

Analyst Says This Is What You Should Expect Next

Este artículo también está disponible en español.

The Bitcoin price hit a new all-time high (ATH) as it surged past $73,700 and rose to as high as $75,000 on November 6. Following this development, crypto analyst Tony Severino has revealed what to expect next from the flagship crypto. 

Bitcoin Price Ready For “Fireworks” After New ATH

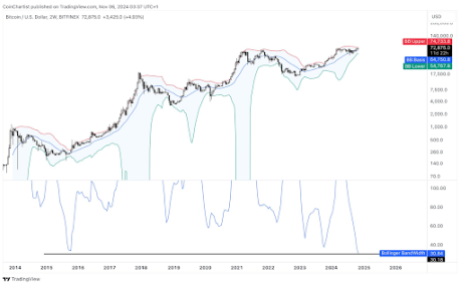
In an X post, Tony Severino indicated that the Bitcoin price is ready to experience a parabolic rally, as he told market participants to expect fireworks above $75,000. The crypto analyst also revealed that Bitcoin was approaching the 2-week upper Bollinger Band while the bands are the tightest in history according to the BBWidth. 

Related Reading

Bitcoin price
Source: X

The accompanying chart, which the crypto analyst shared, showed that the Bitcoin price could rise to as high as $140,000, with the flagship crypto reaching a potential market top in 2025. Tony Severino had previously mentioned that Bitcoin was approaching the strongest part of the bull run and explained how, based on historical trends, BTC could rise to as high as $133,000. 

Indeed, the Bitcoin price looks to be entering the strongest part of the bull run following its rise to a new all-time high. This recent price rally to a new ATH is thanks to Donald Trump, who has been elected to become the next US president. This provides a bullish outlook for Bitcoin and the broader crypto market since the US president-elect has publicly declared his support for Bitcoin and other cryptocurrencies. 

Besides Trump coasting to victory, it is worth mentioning that the Bitcoin price has historically never been below the levels it was at on US presidential election days. Therefore, this is likely the lowest range the flagship crypto might trade at before it records the next parabolic leg of this bull run. 

A Fed Rate Cut Is Also On The Way

In addition to Donald Trump’s victory, some other catalysts are lined up to spark the next leg of the Bitcoin bull run. One is a possible Fed rate cut that is expected to come on November 7, which is bullish for the Bitcoin price. The US Federal Reserve begins its FOMC meeting today and will decide on a rate cut by tomorrow. 

Related Reading

CME Fedwatch data shows a 97.6% chance the Fed will cut interest rates by 25 basis points (bps). This provides a bullish outlook for the Bitcoin price as more capital is set to flow into its ecosystem. Institutional investors are also on the sidelines as they will likely invest more money in the Spot Bitcoin ETFs after the US elections and a Fed rate cut. 

At the time of writing, the Bitcoin price is trading at around $74,500, up over 9% in the last 24 hours, according to data from CoinMarketCap. 

Bitcoin price chart from Tradingview.com
BTC price reaches new ATH | Source: BTCUSD on Tradingview.com

Featured image created with Dall.E, chart from Tradingview.com

Is a Bigger Rally on The Way?

Este artículo también está disponible en español.

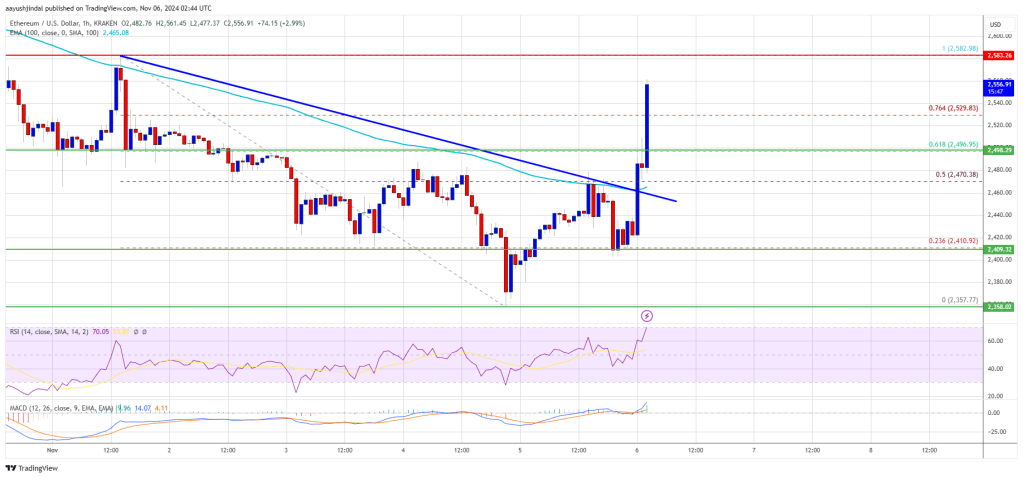
Ethereum price found support near $2,350 and started a fresh increase. ETH is rising and might aim for a move above the $2,580 resistance.

  • Ethereum started a fresh surge above the $2,500 resistance zone.
  • The price is trading above $2,500 and the 100-hourly Simple Moving Average.
  • There was a break above a key bearish trend line with resistance at $2,460 on the hourly chart of ETH/USD (data feed via Kraken).
  • The pair could gain bullish momentum if it settles above $2,580 and $2,620.

Ethereum Price Restarts Increase

Ethereum price found support near $2,350 and started a fresh increase like Bitcoin. ETH was able to climb above the $2,420 and $2,450 resistance levels to move into a positive zone.

It cleared the 50% Fib retracement level of the downward move from the $2,583 swing high to the $2,357 low. Besides, there was a break above a key bearish trend line with resistance at $2,460 on the hourly chart of ETH/USD.

Ethereum price is now trading above $2,500 and the 100-hourly Simple Moving Average. It is also above the 76.4% Fib retracement level of the downward move from the $2,583 swing high to the $2,357 low.

On the upside, the price seems to be facing hurdles near the $2,580 level. The first major resistance is near the $2,620 level. The main resistance is now forming near $2,650. A clear move above the $2,650 resistance might send the price toward the $2,720 resistance.

Ethereum Price
Source: ETHUSD on TradingView.com

An upside break above the $2,720 resistance might call for more gains in the coming sessions. In the stated case, Ether could rise toward the $2,750 resistance zone.

Another Drop In ETH?

If Ethereum fails to clear the $2,620 resistance, it could start another decline. Initial support on the downside is near the $2,520 level. The first major support sits near the $2,500 zone.

A clear move below the $2,500 support might push the price toward $2,450. Any more losses might send the price toward the $2,320 support level in the near term. The next key support sits at $2,350.

Technical Indicators

Hourly MACDThe MACD for ETH/USD is gaining momentum in the bullish zone.

Hourly RSIThe RSI for ETH/USD is now above the 50 zone.

Major Support Level – $2,450

Major Resistance Level – $2,620

Why Is Dogecoin Going Up? Key Drivers Of DOGE’s 10% Surge

Este artículo también está disponible en español.

While the broader crypto market experiences a slight downturn ahead of today’s US presidential election, Dogecoin (DOGE) has defied the trend by surging 10% in the last 24 hours. Over the past three days, DOGE has rallied more than 20% from its local low of $0.14219 on Sunday. Analysts attribute this remarkable performance to speculation surrounding the election and its potential impact on Dogecoin.

Why Is Dogecoin Price Going Up Today?

Several crypto analysts have identified Dogecoin as the leading “Trump trade” within the crypto market—a proxy for betting on a Donald Trump victory in the presidential election. This association stems from Elon Musk’s proposal about leading a “Department of Government Efficiency” (D.O.G.E.) under a Trump administration to reduce government spending.

Russian Market (@runews) suggested that if Trump wins, “Elon Musk will land a role at the White House, potentially making Dogecoin one of the ‘official’ cryptocurrencies.” This speculation is considered one reason why Dogecoin is rallying even as Bitcoin faces a decline.

Related Reading

Mammon (@D_DTRADING) also highlighted Dogecoin’s strong performance, arguing that Dogecoin might have become a leveraged bet for a Trump win. “Dogecoin showing great relative strength and imo this has to do with Elon’s involvement in supporting Trump. In which Dogecoin might have become the leveraged bet for a Trump win. Trump win > Doge to the moon??” he remarked.

Miles Deutscher emphasized Dogecoin’s role as a catalyst in the crypto market: “DOGE pumps (D.O.G.E initiative will propel DOGE + it’s already showing strength as a proxy). DOGE as the meme leader will also drive attention + liquidity rotation to the broader meme narrative. Think of it as the spark that lights the fire.”

Former investment bank trader Pablo Heman (@RealPabloHeman) observed that “DOGE is the only green in a sea of red cryptos,” implying a correlation between Dogecoin’s performance and the political developments.

He pointed out: “The polls are confusing and contradicting, and actually they are FAKE! But the market does not lie! There is a clear, late surge in DJT the Trump stock, which is now making a Bullish Engulfing Pattern over yesterday’s red bar. […] And also DOGE is the only green in a sea of red cryptos. So just keep in mind Trump = DJT and Elon Musk = DOGE.”

Related Reading

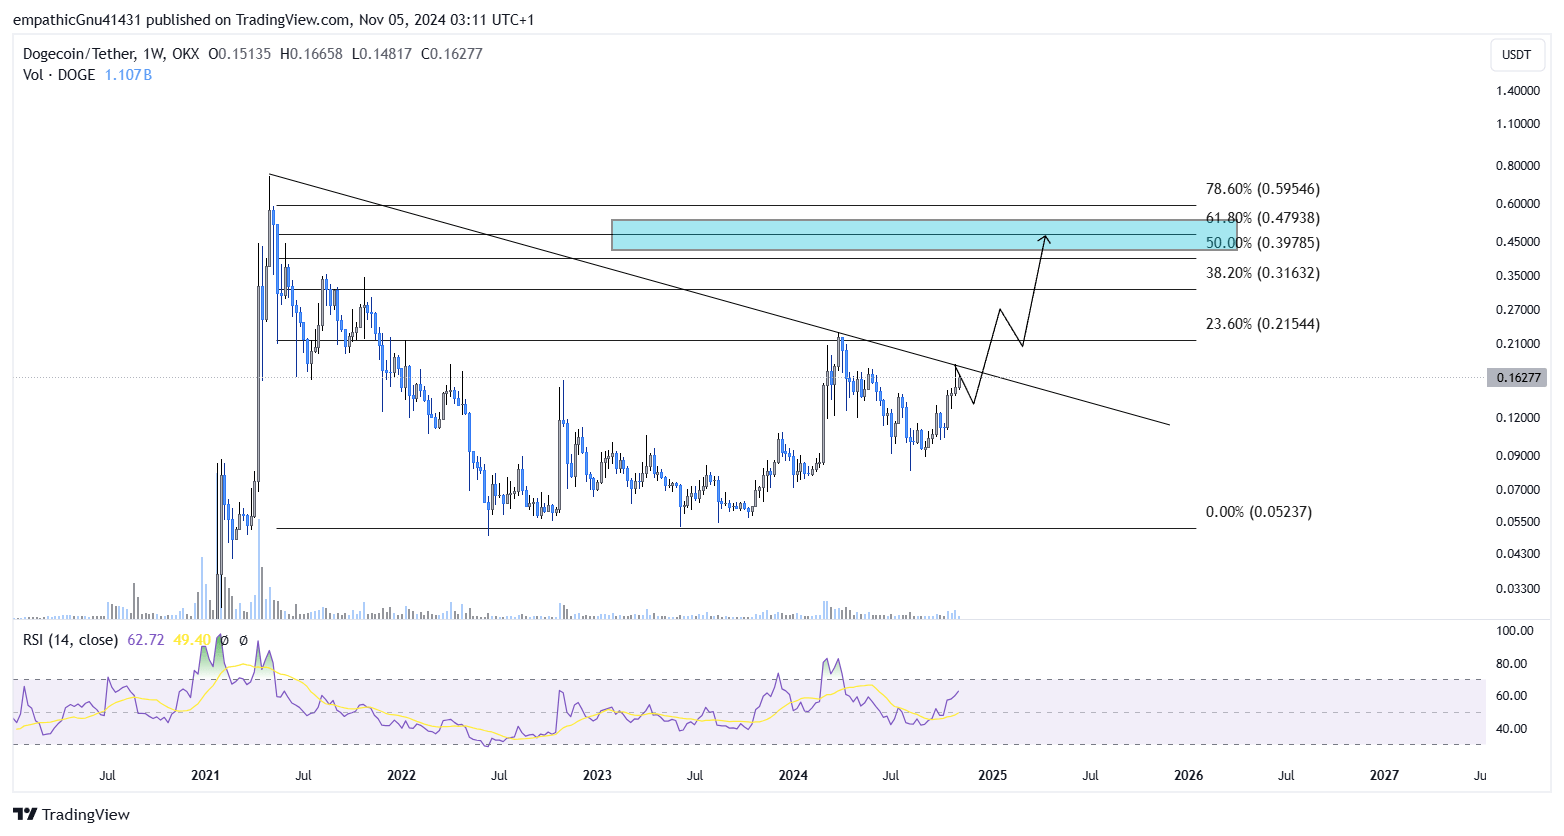
Andrea Capellini, founder of Freedom Trading Academy, expressed bullish sentiments on Dogecoin’s potential, suggesting that a Trump and Elon win could send DOGE to $0.47. Capellini’s technical analysis highlights key Fibonacci retracement levels applied from the low at $0.05237 to the recent peak at $0.59546.

Dogecoin price analysis
Dogecoin price analysis, weekly chart | Source: @AndreaCapellin4

Notably, Dogecoin’s price is currently testing the resistance zone just beneath the 23.6% level at $0.21544. Breaking through this resistance could pave the way toward Capellini’s target of $0.47. The Relative Strength Index, a momentum oscillator, stands at 62.72, placing it in the upper neutral zone. This reading indicates growing bullish momentum without yet entering overbought territory (above 70). The current RSI level supports a cautiously optimistic outlook for the continuation of the upward trend.

Moreover, the weekly chart for Dogecoin exhibits a bullish pattern characterized by a series of higher lows and higher highs—a classic sign of a sustained uptrend. However, DOGE is currently facing a downtrend line that has previously acted as resistance. A decisive breakout above this line is crucial to reach higher price targets, including Capellini’s projection of $0.47.

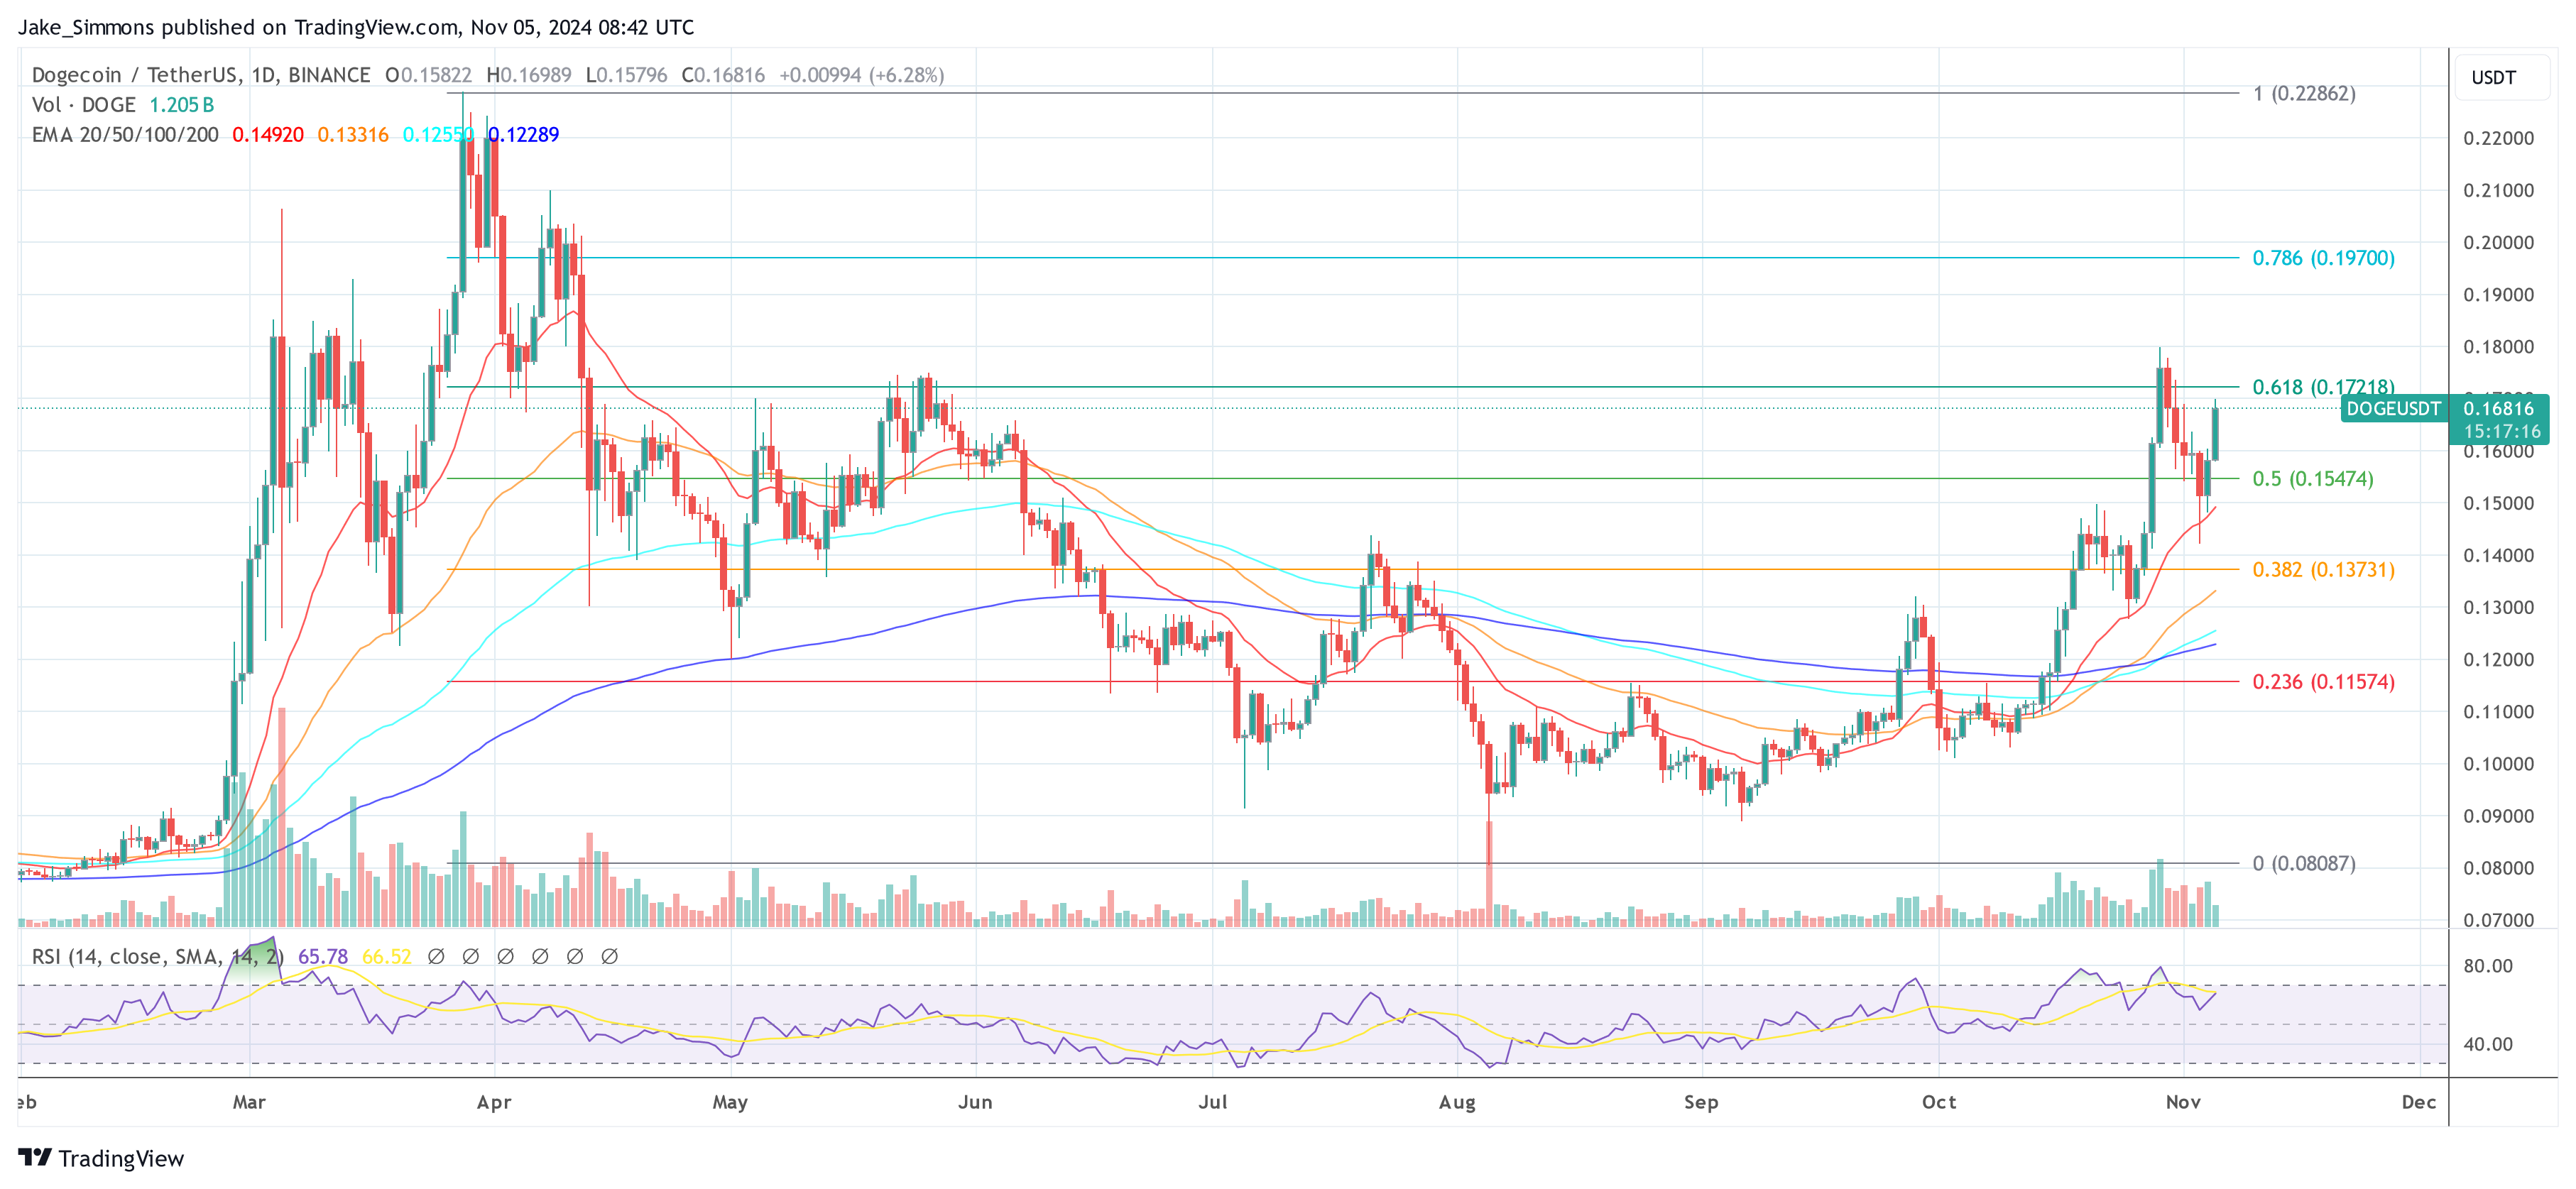
At press time, DOGE traded at $0.16816.

Dogecoin price
Dogecoin price, 1-day chart | Source: DOGEUSDT on TradingView.com

Featured image created with DALL.E, chart from TradingView.com

Bitcoin ETFs Surpass 1 Million BTC Holdings In Less Than A Year Since Launch

Este artículo también está disponible en español.

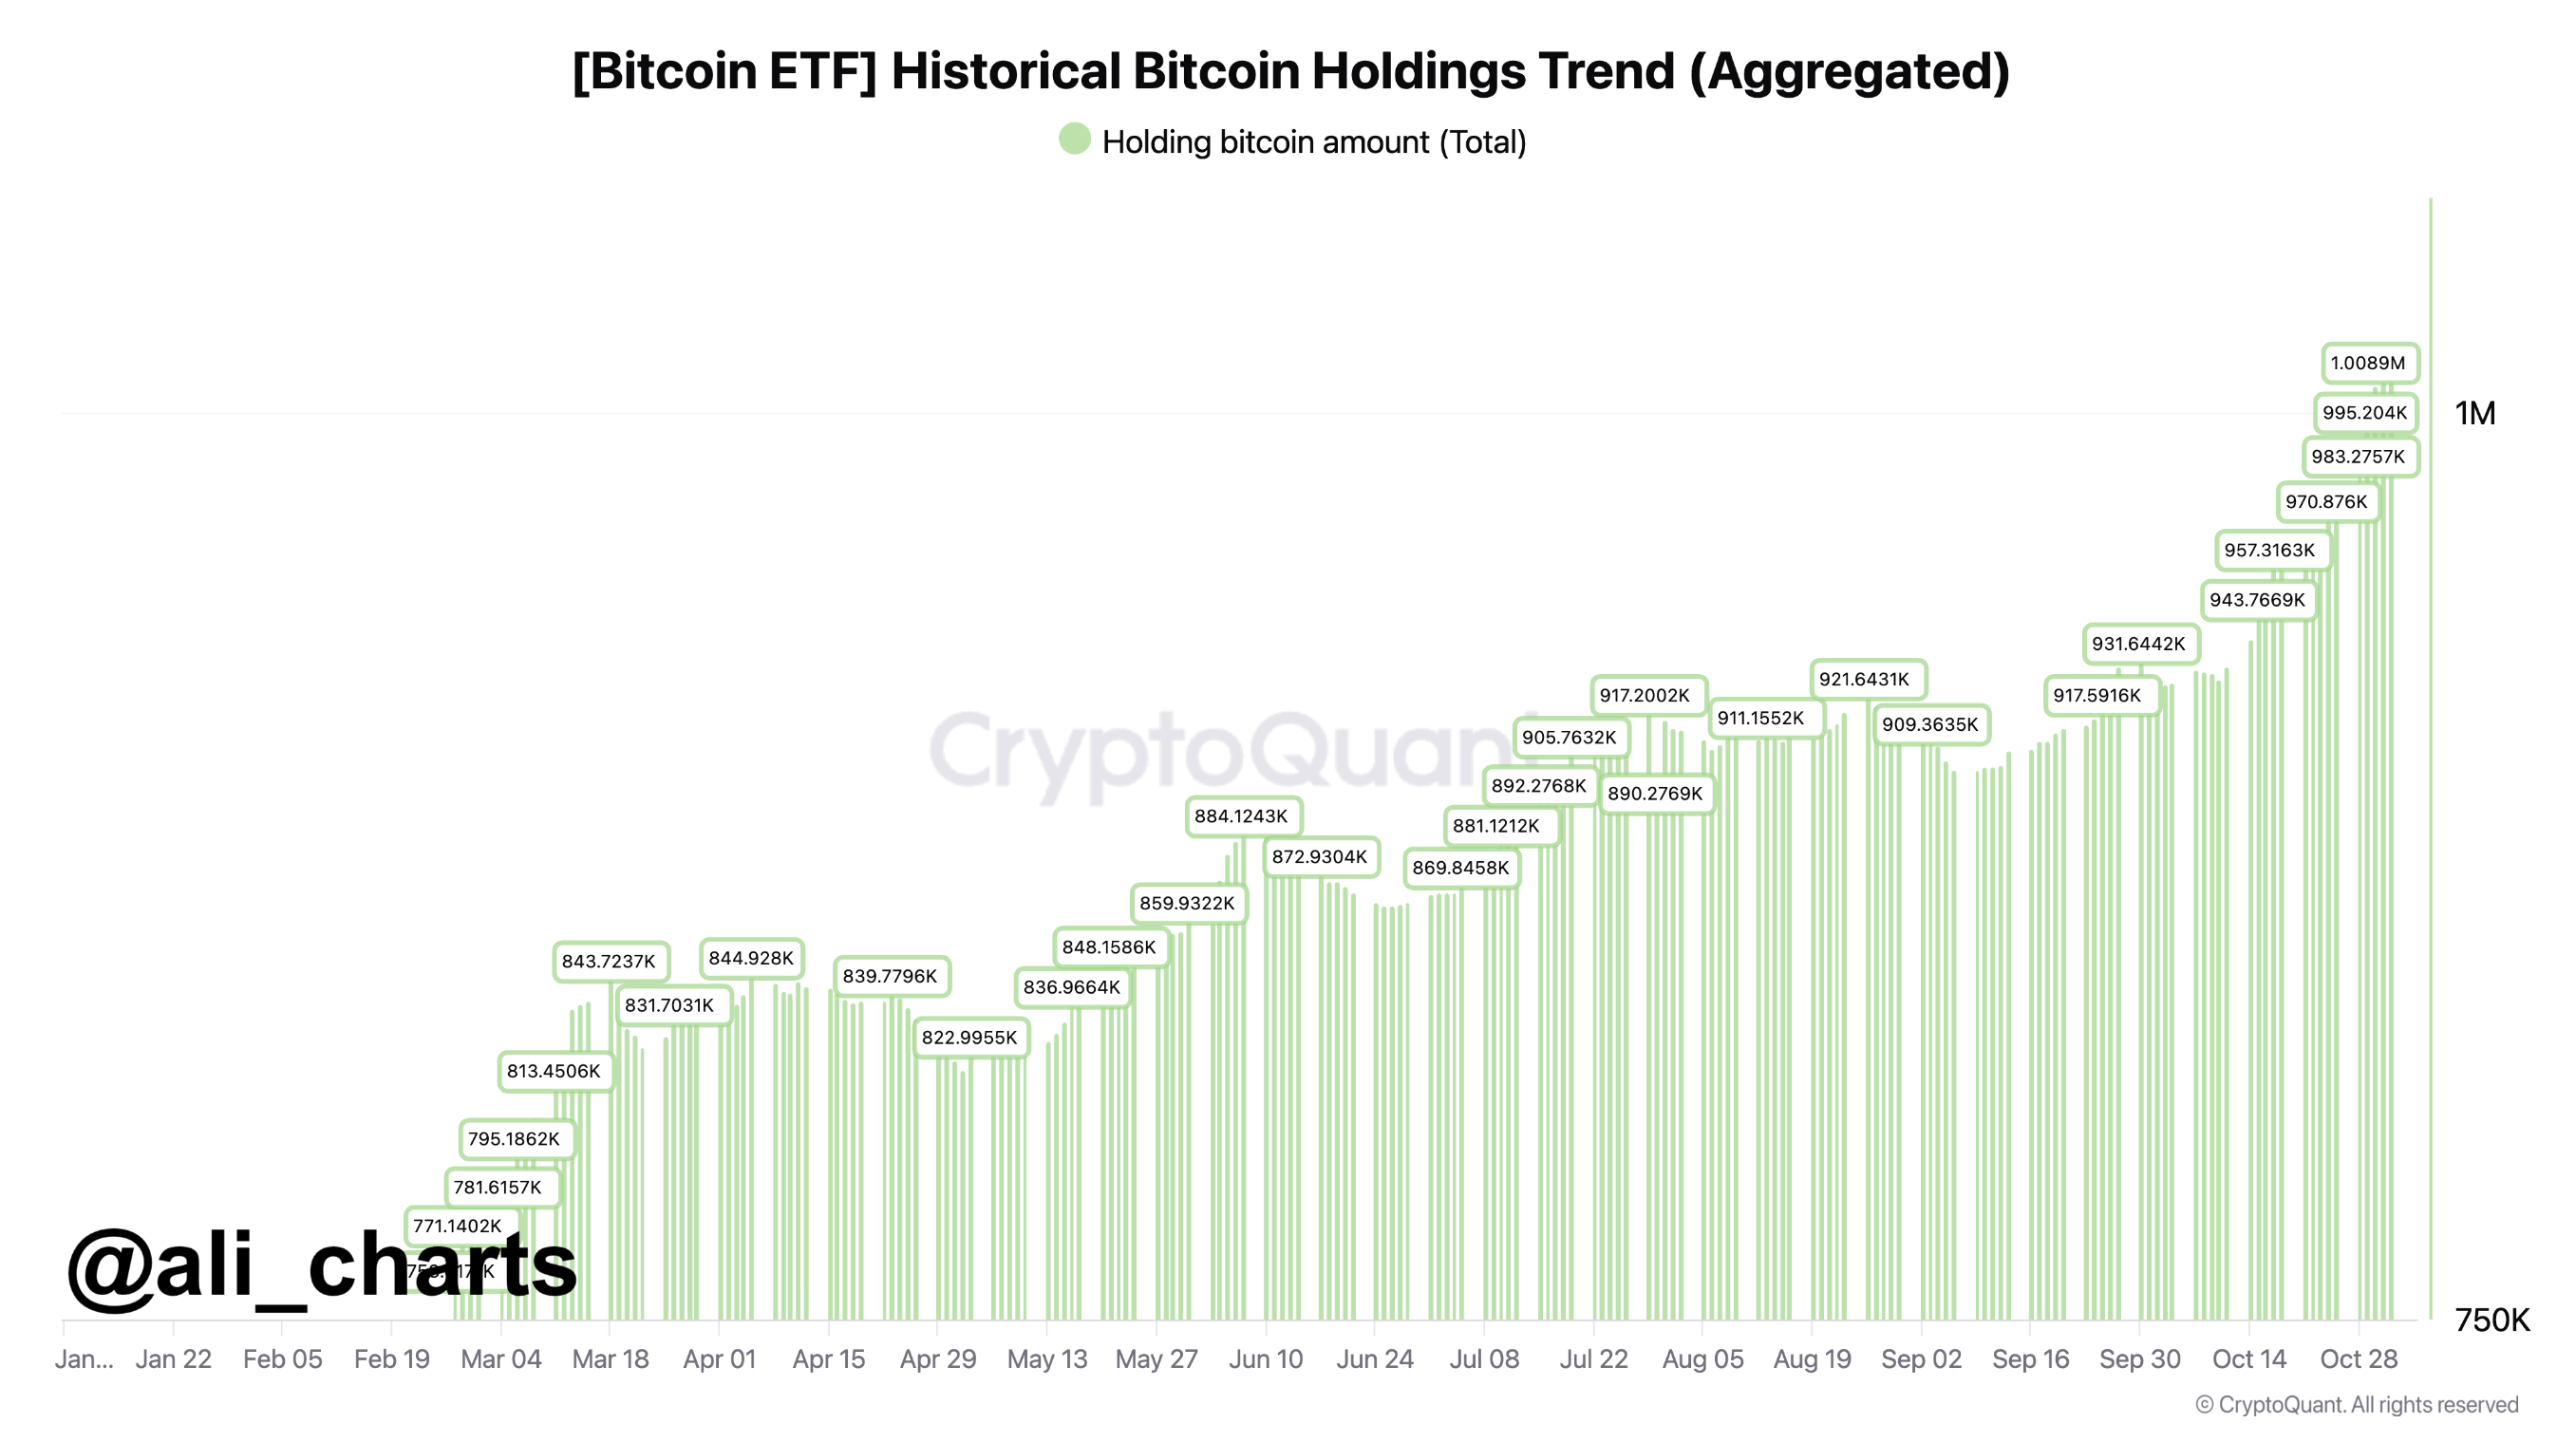
Bitcoin (BTC) exchange-traded funds (ETFs) have collectively acquired over one million BTC in less than a year since their launch, reflecting strong demand for the digital asset among investors.

Bitcoin ETFs Surpass One Million BTC Milestone

According to a chart shared by crypto analyst Ali Martinez on X, the cumulative BTC holdings in Bitcoin ETFs have exceeded one million BTC within this short period.

BTC etf
Source: ali_charts on X

To recall, after a lot of deliberation, the US Securities and Exchange Commission (SEC) approved spot Bitcoin ETFs earlier this year in January. To say that Bitcoin ETFs have proven to be a resounding success won’t be an overstatement.

Related Reading

Bitcoin ETFs have recorded a cumulative total net inflow of $24.15 billion to date. Martinez added that the total value of BTC held by these ETFs currently stands at approximately $70 billion.

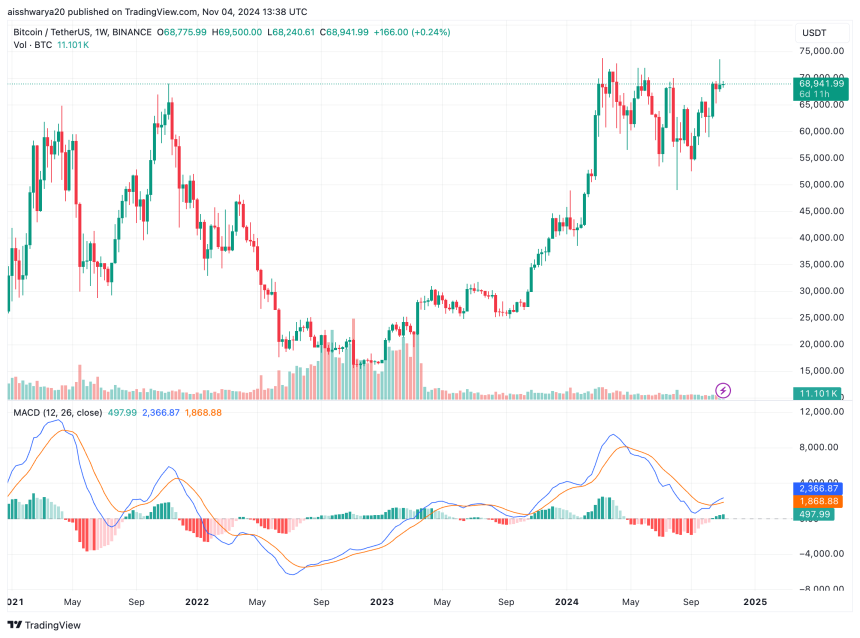
From a price perspective, BTC has jumped from about $41,900 on January 8 to its current price of $68,941, marking an increase of almost 65%. During this period, BTC reached an all-time high (ATH) of $73,737 in March.

With over a million BTC now held in Bitcoin ETFs, roughly 5% of the total 21 million BTC supply is tied up in these financial products, reinforcing Bitcoin’s scarcity narrative.

Notably, asset manager BlackRock’s IBIT spot BTC ETF leads the market, holding approximately $30 billion net assets. Grayscale’s GBTC follows with $15.22 billion, and Fidelity’s FBTC ranks third with $10.47 billion in net assets.

The growing interest in Bitcoin ETFs is also highlighted in a recent CoinShares report, which found that digital asset investment products attracted inflows of over $2.2 billion last week.

CoinShares attributed the recent surge in crypto product inflows to the possibility of a Republican victory in the upcoming US presidential election on November 5.

Interestingly, higher inflows were seen at the beginning of the week, while outflows emerged toward the end as Democratic candidate Kamala Harris’s odds of winning improved.

At the time of writing, decentralized prediction markets platform Polymarket shows Harris a 41.6% chance of winning the presidency, while Republican candidate Donald Trump remains the favorite with a 58.5% chance.

Trump Win To Benefit Crypto, Experts Opine

While voter opinion on other policies might be split more evenly, the overall consensus as far as crypto is concerned seems to be that a Trump victory may benefit BTC and other digital assets.

Related Reading

Earlier this month, JPMorgan stated that retail investors increasingly view BTC as a ‘debasement trade’ to protect their assets’ purchasing power amid inflation and that a Trump win could provide ‘additional upside’ to BTC.

That said, Kamala Harris, Biden’s current vice president, is reportedly taking a fresh approach to digital assets, in contrast to the current administration’s perceived cautious stance. Whether this will boost her popularity among crypto-focused voters remains to be seen.

At press time, Bitcoin is trading at $68,941, up 0.8% in the past 24 hours. According to CoinGecko data, Bitcoin dominance stands at 56.7%.

bitcoin
BTC trades at $68,941 on the weekly chart | Source: BTCUSDT on TradingView.com

Featured image from Unsplash, Charts from X and Tradingview.com

Solana Expected To Reach $500 By Bull Run’s End: Crypto Analyst

Este artículo también está disponible en español.

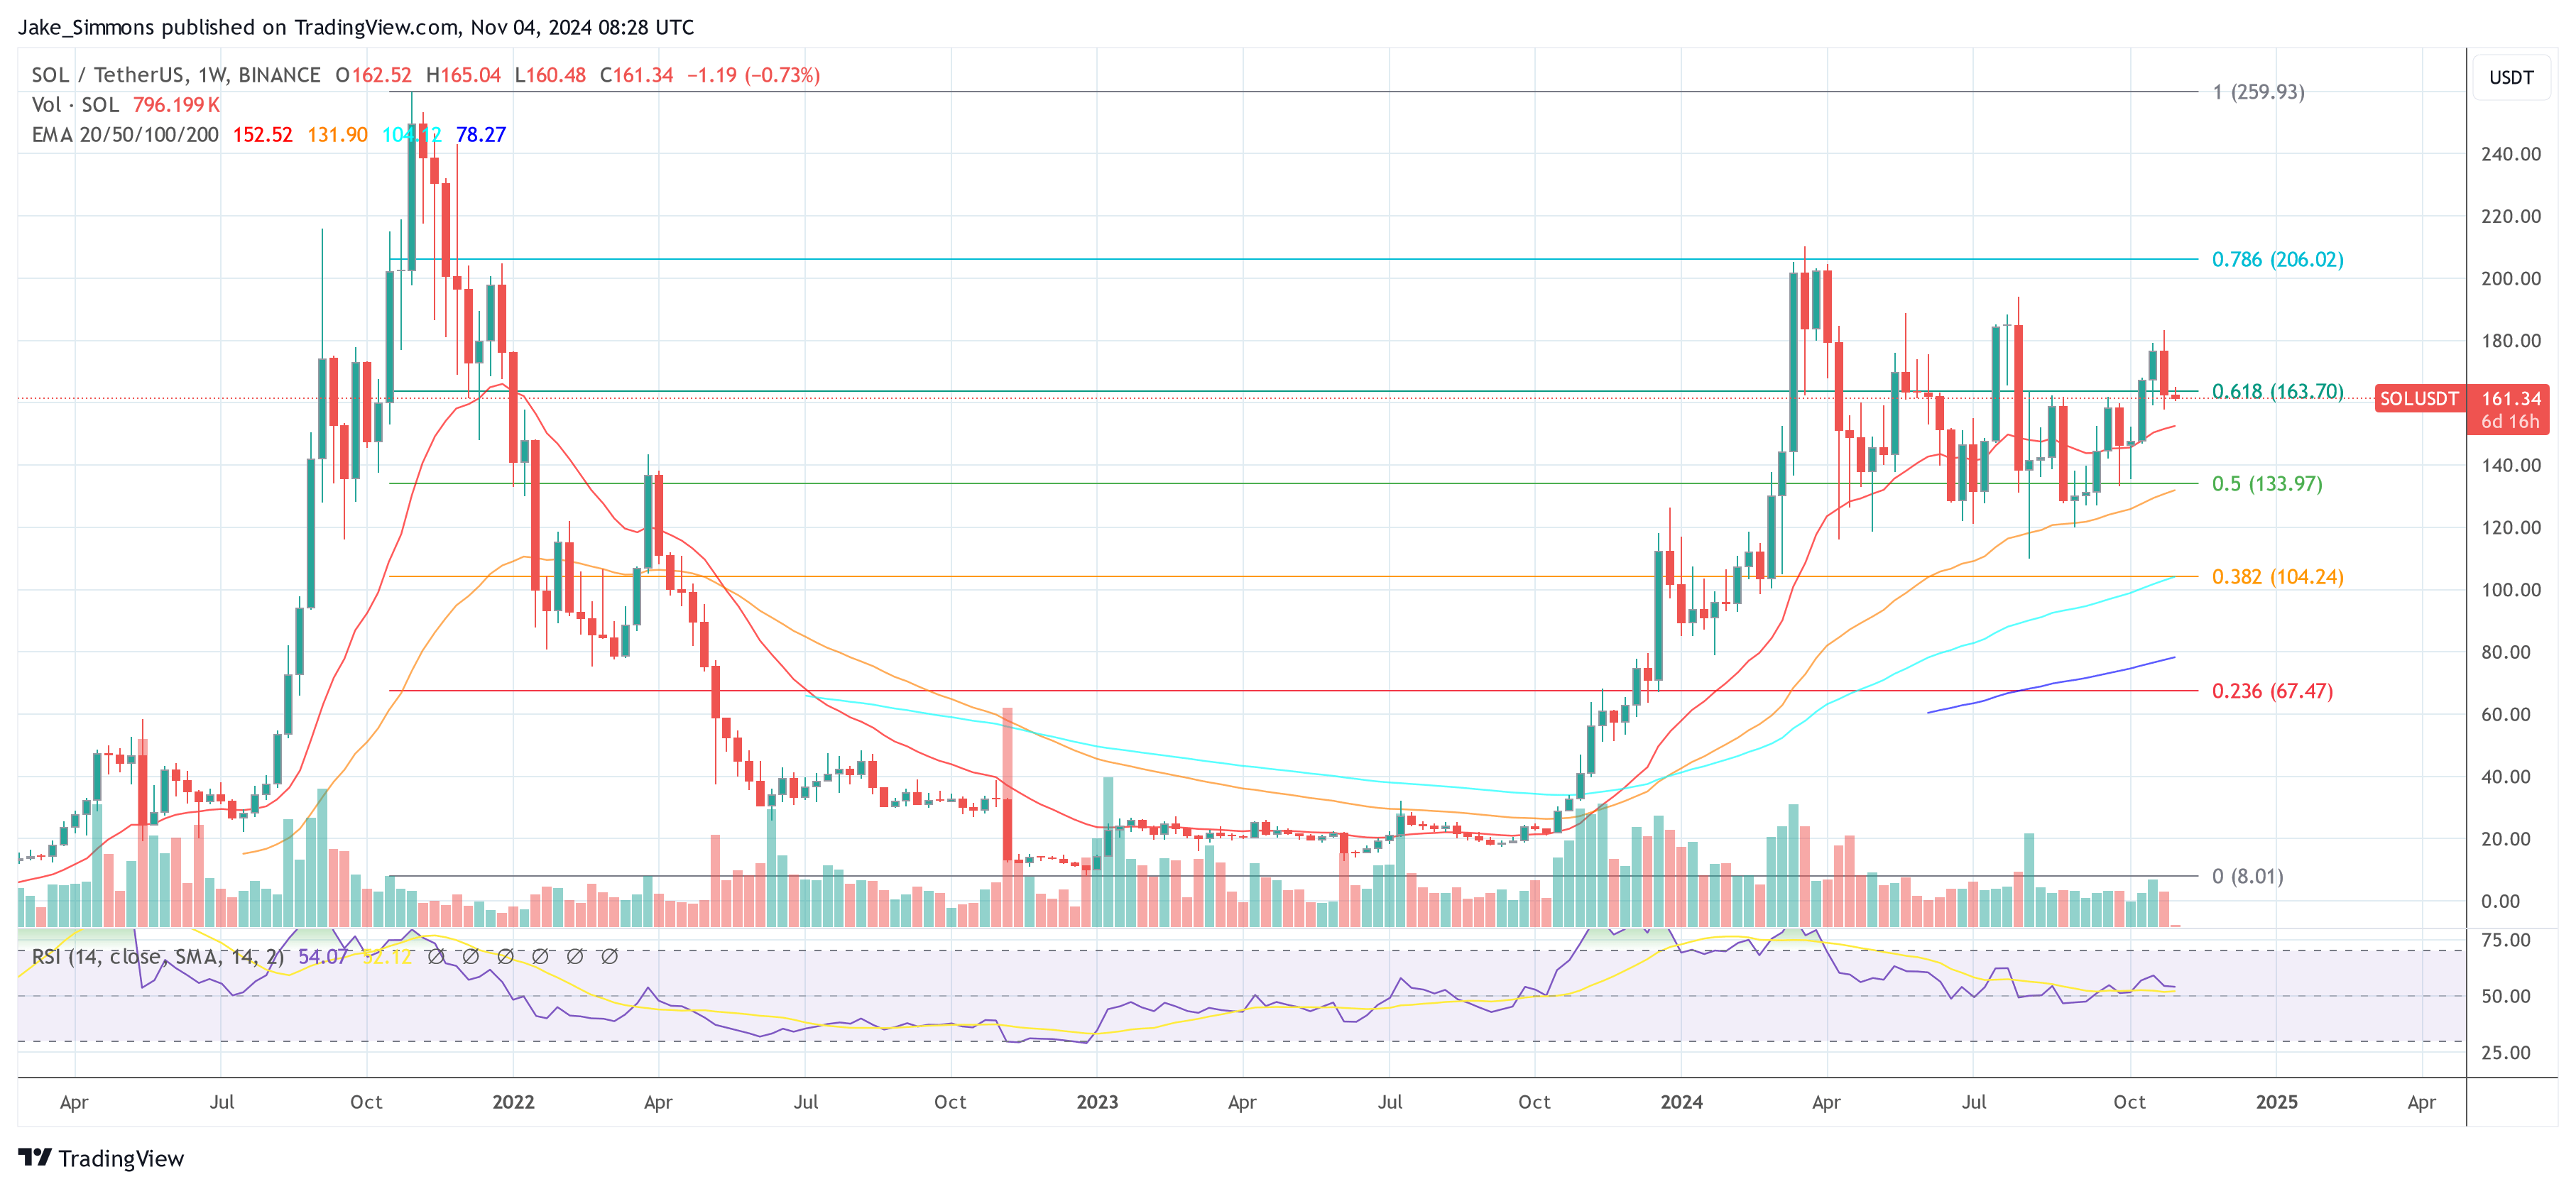
In an analysis shared on X, popular crypto analyst Gum (@0xGumshoe) is projecting that Solana (SOL) could ascend to $500 by the conclusion of this bull run. This bullish forecast hinges heavily on the outcome of the US presidential election, slated for November 5th, and the potential policy changes that could follow.

Solana Price Prediction For This Bull Run

@0xGumshoe initiated his forecast with a bold declaration: “SOL TO $500. The upcoming US elections will affect SOL more than any other token. Here’s why I’ve changed my price target.” Delving into the potential scenarios, @0xGumshoe examined the implications of both possible election outcomes—whether Kamala Harris secures the presidency or Donald Trump returns to office. Each scenario presents distinct pathways for Solana’s trajectory.

Related Reading

In the event of a Kamala Harris victory, @0xGumshoe anticipates a mixed impact on Solana. He noted, “BTC and SOL have outperformed during Biden/Harris,” pointing especially to the performance of the past year under the current administration. The approval of the spot Bitcoin and Ethereum Exchange-Traded Funds (ETFs) during the Biden/Harris tenure is highlighted by the analyst as a positive factor that could continue to benefit Solana. Additionally, Harris’s supposed commitment to a “less aggressive stance towards crypto” regulation suggests a more favorable environment for the growth of Solana.

However, @0xGumshoe also cautioned about potential challenges under a Harris administration. He remarked, “Less regulatory clarity” and a potential new term for SEC Chair Gary Gensler could complicate things for Solana. Furthermore, the possibility of a spot Solana ETF facing rejection and an increase in Bitcoin dominance might overshadow altcoins.

good bad Harris victory
The good and the bad of a Harris victory | Source: X @0xGumshoe

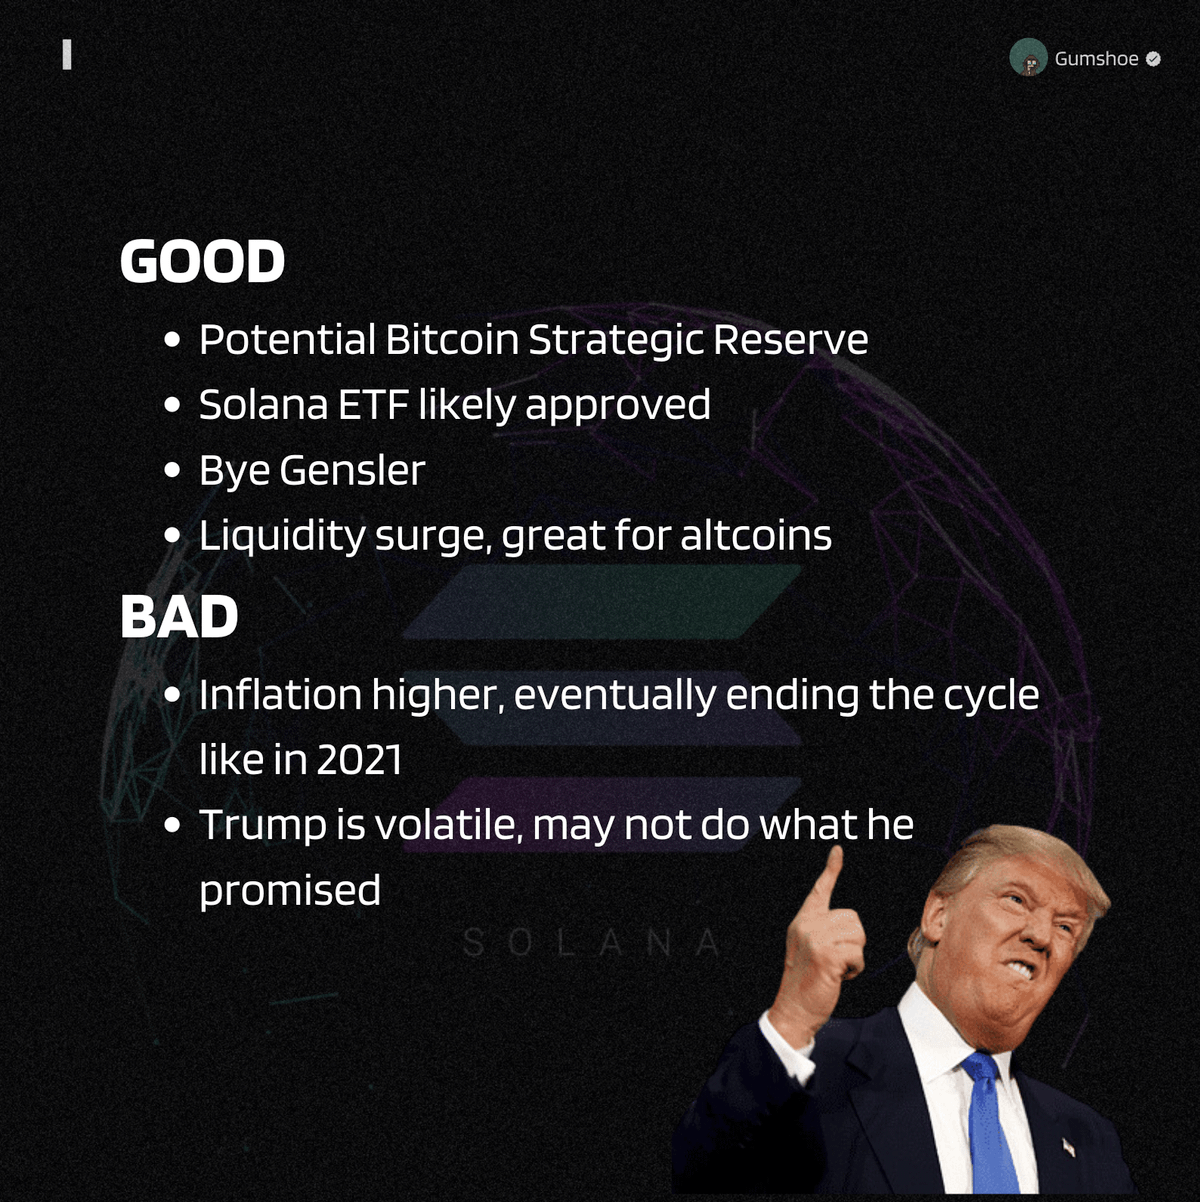
Conversely, @0xGumshoe presented a more bullish outlook if Donald Trump wins the election. He asserted, “A Trump win will send Solana to ATHs as the market realizes a SOL ETF will be coming.” The analyst emphasized that unlike Bitcoin and Ethereum, Grayscale is unlikely to offload significant amounts of Solana, which could help sustain its price. Additionally, the analyst points to the possibility of establishing a Bitcoin Strategic Reserve and the departure of SEC Chair Gary Gensler as bullish catalysts for SOL.

Related Reading

However, a Trump victory could also have downsides. @0xGumshoe acknowledged that “higher inflation could eventually end the cycle like in 2021.” Furthermore, he noted Trump’s inherent volatility, stating that the former president “may not do what he promised,” which introduces an element of unpredictability to the projections.

good bad Trump victory
The good and the bad of a Trump victory | Source: @0xGumshoe

In light of these scenarios, @0xGumshoe revised his selling targets for Solana. Previously advocating for a $300 sell target, he now contemplates a higher threshold of $500, contingent upon a Trump win and an increase in macro liquidity. He explained, “If we pair up a Trump win and increase macro liquidity, I will instead sell over time for as long as I believe we hit $500.”

The rationale behind the $500 price target is anchored in Solana’s fully diluted valuation (FDV). @0xGumshoe articulated, “At that price, Solana would have a $291B FDV which would put it at the current ETH market cap.” He views this valuation as a significant benchmark, suggesting that Solana’s price could approach Ethereum’s market capitalization unless there is a substantial influx of investments through ETFs, which could propel the token beyond this threshold.

Under the Harris administration, @0xGumshoe’s price target for Solana remains at $300. @0xGumshoe concluded his analysis by advising caution, stating, “The elections alone are not enough to predict tops for Solana so take this with a grain of salt. Whatever happens, it is quite obvious that SOL will go far higher with Trump than Harris.”

At press time, SOL traded at $161.

Solana price
SOL price, 1-week chart | Source: SOLUSDT on TradingView.com

Featured image from Coinbase, chart from TradingView.com

Solana Likely To Target $200 ‘If It Holds Current Support’ – What To Expect

Este artículo también está disponible en español.

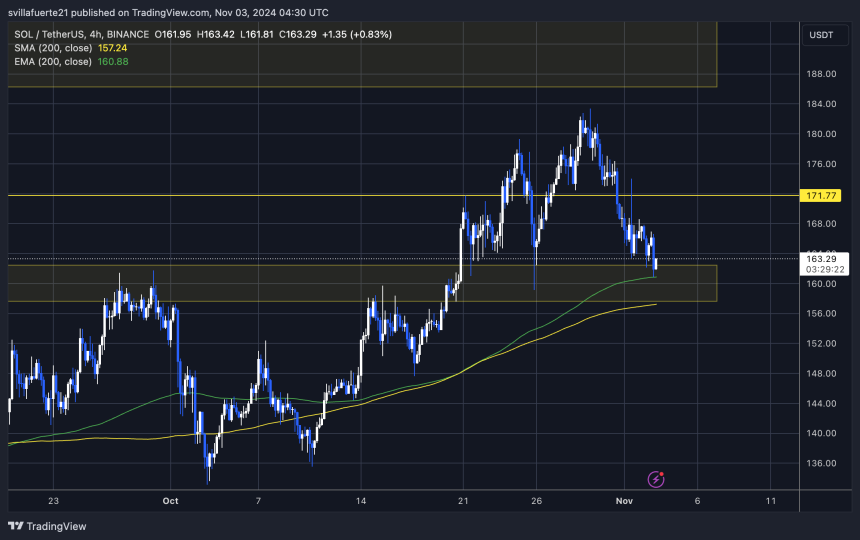
Solana (SOL) is currently trading at a crucial demand level near $163, following a retrace from local highs around $183. This price is a critical support area that could determine the direction of SOL’s upcoming price action. Losing this level could signal a deeper correction, which would intensify selling pressure and potentially push SOL to retest lower support levels.

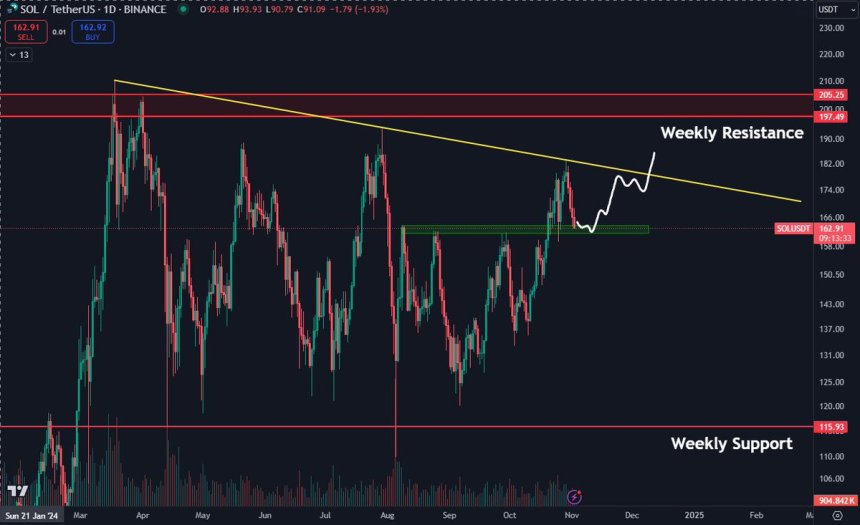
However, top analyst Daan shared a technical analysis suggesting that if SOL can hold this “green zone” around $160, it could pave the way for a rebound. Daan notes that in the most optimistic scenario, SOL could hold this support and start a gradual climb, ultimately aiming to test the downtrend line that has kept it in check. This setup would keep SOL’s bullish structure intact, creating a potential entry point for investors eyeing a bounce.

Related Reading

With the broader crypto market showing volatility and Solana facing this pivotal level, the next few days will be crucial. Traders and investors are closely watching to see if this demand zone can support a reversal, potentially leading SOL back toward recent highs.

Solana Holding Strong Despite Uncertainty

Solana (SOL) has managed to hold above the key support level around $160, despite the recent market volatility and uncertainty. This level is crucial for SOL’s price structure, as it’s a strong demand zone that could act as a foundation for the next upward move. 

Crypto analyst Daan recently shared his perspective on X, revealing that SOL’s “most bullish case” would be for it to hold this “green zone” around $160, allowing it to gradually grind back up toward the descending trendline that has capped recent gains.

Solana testing crucial demand
Solana testing crucial demand | Source: Daan on X

In Daan’s view, the next attempt at this trendline could likely result in a successful breakout, with the potential to push SOL’s price above $200. He suggests that waiting for confirmation of this breakout could be a sound strategy for cautious investors, as there is still ample room for upside even after a confirmed reversal. His analysis highlights a confident outlook on SOL’s potential recovery, seeing this accumulation zone as a promising buying opportunity.

However, Daan also acknowledges that there’s still a degree of downside risk. If SOL fails to hold above this $160 level, a deeper correction could follow, potentially driving SOL to test lower support levels. 

Related Reading

For now, the market will watch this support level closely as a critical indicator of SOL’s short-term trend. Holding above it would signal strength and open the door for a potential rally, while a breakdown could lead to a more extended bearish phase. As the overall market sentiment remains mixed, Solana’s next moves will be critical for traders and investors alike.

SOL Price Action 

Solana is currently trading at $163 after tagging the 4-hour 200 exponential moving average (EMA), a critical indicator of short-term strength. Holding above this EMA signals a bullish outlook for SOL, suggesting that buyers are stepping in to support the price at this level. If SOL can maintain momentum above the 200 EMA, it could build a foundation for a potential rally to new local highs, possibly challenging the recent peak around $183.

SOL tagging the 4H 200 EMA
SOL tagging the 4H 200 EMA | Source: SOLUSDT chart on TradingView

However, the $160 level remains a crucial support area. Losing this support would likely trigger significant selling pressure, potentially driving SOL down to the $150 range, where further demand may emerge. This zone would be closely watched by investors looking for potential accumulation opportunities, as a dip could provide favorable entry points for long-term holders.

Related Reading

In contrast, a strong push above the current demand level would confirm renewed bullish momentum, paving the way for SOL to target and possibly surpass recent highs. As SOL hovers around this key technical zone, traders will be watching for any decisive movement that could signal the next direction, whether it be a continued uptrend or a retracement to lower demand levels.

Featured image from Dall-E, chart from TradingView

Total Value Locked Hits $5.7 Billion, Ranks Third Among Networks

Este artículo también está disponible en español.

A recent report from crypto data and research firm Messari has shed light on the performance of the Solana (SOL) ecosystem during the third quarter of 2024. The report highlights a mixture of growth and challenges faced by the blockchain amid broader volatility in the cryptocurrency market during that period.

Solana Stablecoin Market Cap Rises To $3.8 Billion

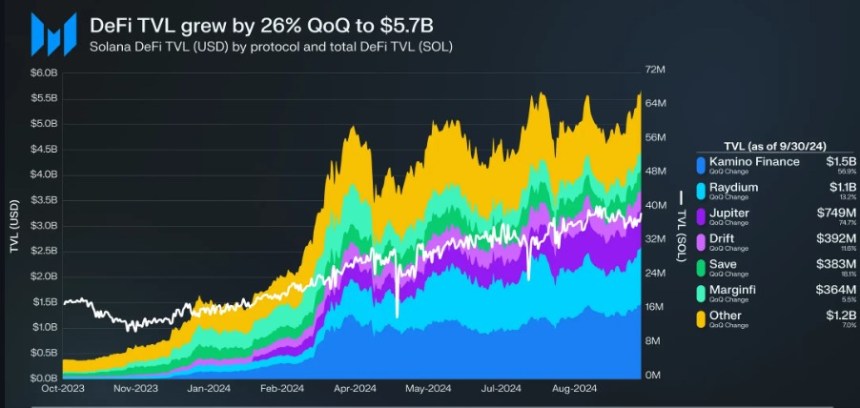
One of the standout metrics from the report is the growth of Solana’s Total Value Locked (TVL) in decentralized finance (DeFi), which rose by 26% quarter-over-quarter (QoQ) to reach $5.7 billion. 

This growth positioned Solana as the third-largest network in terms of DeFi TVL, surpassing Tron in late September. Notably, the TVL denominated in SOL also increased, growing by 20% QoQ to 37 million SOL.

Related Reading

Solana
Solana’s Q3 TVL growth. Source: Messari

Kamino emerged as a leading player within the Solana ecosystem, experiencing a 57% growth in TVL, ending the quarter with $1.5 billion and capturing a 26% market share. This surge is attributed to the integration of new tokens, including PayPal’s USD (PYUSD) and jupSOL, which have enhanced the platform’s appeal.

Despite the overall positive trends, decentralized exchange (DEX) volume experienced a slight decline, reflecting a downturn in memecoin trading. Average daily spot DEX volume fell by 10% QoQ to $1.7 billion. 

Per the report, the diminishing interest in memecoins was evident, as only two tokens—WIF and POPCAT—managed to make it into the top ten by trading volume for the quarter.

In contrast, Solana’s stablecoin ecosystem showed resilience, with the market cap for stablecoins growing by 23% QoQ to $3.8 billion, solidifying its rank as the fifth-largest network in this category. 

On the non-fungible token (NFT) front, however, the performance was less favorable. Average daily NFT volume fell by 27% QoQ to $2.5 million, with Magic Eden maintaining a dominant market share despite experiencing a 44% decline in volume. 

Network Activity Thrives

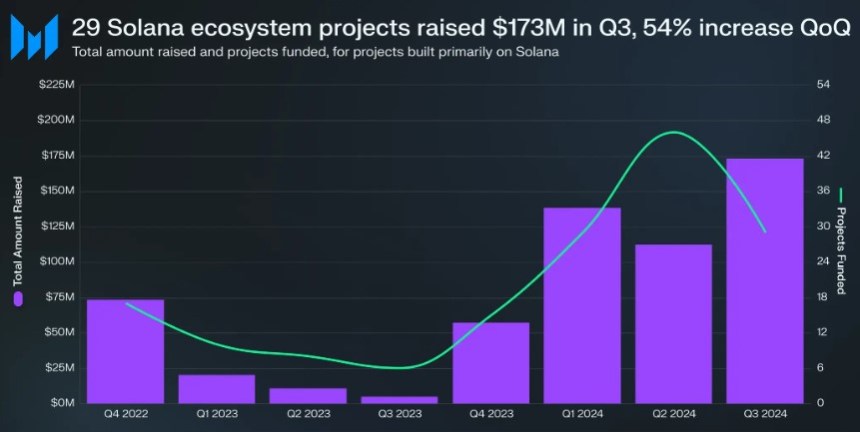
Despite the challenges, the number of funding rounds for projects within the Solana ecosystem saw a reduction of 37% QoQ, with only 29 projects announcing funding. Yet, the total amount raised soared to $173 million, a 54% increase QoQ and the highest quarterly funding since Q2 2022.

Solana
Funding growth in the Solana blockchain during Q3. Source: Messari

Network activity remained robust, as evidenced by a 109% increase in average daily fee payers, which reached 1.9 million. Additionally, the average daily new fee payers grew by 430% QoQ to 1.3 million, signaling a growing user base. 

Related Reading

The average transaction fee on Solana increased by 6% QoQ to 0.00015 SOL (approximately $0.023), while the median transaction fee dropped by 19% to 0.000008 SOL (around $0.0013). 

As of October 15, Solana’s market capitalization also grew by 5% QoQ, reaching $71 billion and maintaining its position as the fifth-largest cryptocurrency, trailing only Bitcoin, Ethereum, Tether, and Binance Coin. 

However, the Real Economic Value (REV) of Solana, which tracks transaction fees and miner extractable value (MEV) for validators, decreased by 25% QoQ to 1.3 million SOL (approximately $196 million), with 56% of this total coming from transaction fees.

Solana
The daily chart shows SOL’s price retrace experienced over the past 72 hours. Source: SOLUSDT on TradingView.com

At the time of writing, SOL was trading at $166, down 5% for the seven day period.

Featured image from DALL-E, chart from TradingView.com