Solana Headed For Correction Before Bounce – Analyst Sets $180 Target

Solana Headed For Correction Before Bounce – Analyst Sets $180 Target

Este artículo también está disponible en español.

Solana (SOL) is trading around a crucial demand level at $165, following a pullback from recent highs of $183. This level is pivotal for SOL, as losing it could trigger a deeper correction, putting the altcoin at risk of further downside. 

However, prominent analyst Carl Runefelt has shared technical analysis indicating that Solana may be primed for a brief correction before staging a rally to retest local highs.

Related Reading

Runefelt’s analysis highlights signs of renewed strength for SOL, suggesting that the altcoin is preparing for a move that could challenge recent highs within the next few days. This bullish setup depends heavily on Solana maintaining support at $165, which could act as a launchpad for further upward momentum. 

As the crypto market closely watches Bitcoin’s bid for a new all-time high, Solana investors are bracing for potential volatility. In this uncertain landscape, Solana remains a focal point for investors who see an opportunity if support holds steady. 

Solana Holding Key Demand Level

Solana (SOL) has emerged as one of the stronger-performing altcoins this cycle, drawing significant attention as it tests a key demand level that could drive it toward new highs. Prominent analyst and investor Carl Runefelt recently shared a technical analysis on X, indicating that SOL may briefly dip to around $160 before staging a push to retest its recent high at $180.

According to Runefelt, this $160 level represents a critical support zone for Solana, as holding above it is essential to sustain the altcoin’s bullish momentum and confirm its ongoing uptrend. Runefelt’s analysis emphasizes the importance of this support level in fueling Solana’s potential for gains, suggesting that it could serve as a springboard for a substantial rally. 

Solana facing a small correction before a move to $180
Solana facing a small correction before a move to $180 | Source: Carl Runefelt on X

If SOL successfully holds above $160, a surge to test local highs would not only reinforce confidence among investors but also set the stage for Solana to push into new territory if broader market conditions remain favorable.

The coming week could prove pivotal for SOL as the market braces for heightened volatility with the US election on the horizon (Nov 5) and Bitcoin nearing its all-time high.

Related Reading

As investors monitor macro events and Bitcoin’s movements closely, Solana’s technical setup around $160 will be a focal point for those seeking to capitalize on the altcoin’s potential gains. If Solana maintains its bullish structure, it could play a key role in leading the altcoin market forward in this cycle.

SOL Technical Levels To Watch

Solana is trading at $166 after a slight rebound from the $163 level, maintaining a strong position above the critical $160 support zone. This level has proven to be a vital threshold for SOL, as a sustained hold here could set the stage for a rally toward higher resistance levels. 
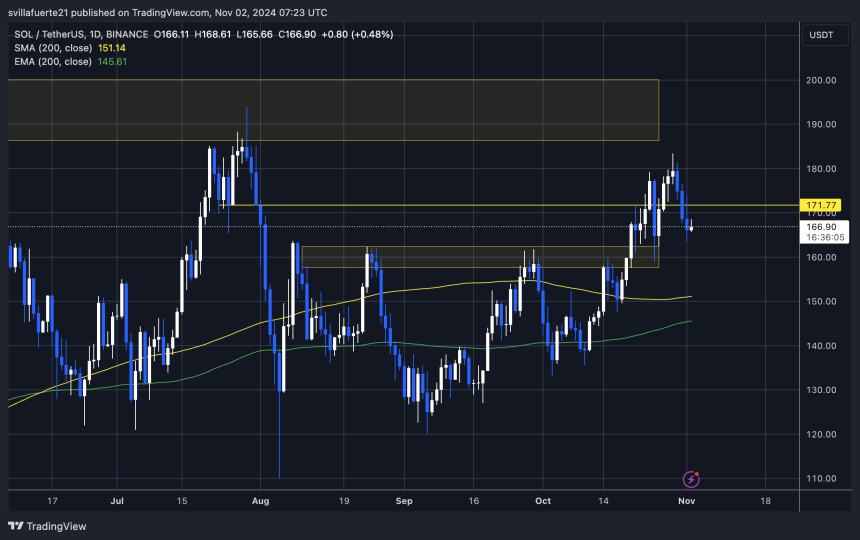
SOL holding above the $160 mark
SOL holding above the $160 mark | Source: SOLUSDT chart on TradingView

If buyers successfully defend $160, it may serve as the foundation for a climb to $183 and potentially beyond, with higher supply zones likely to be tested.

Related Reading

Analysts are watching this level closely, as it could either reinforce SOL’s bullish structure or signal the need for further consolidation. A breakdown below $160, however, would likely lead to a deeper correction, prompting traders to recalibrate their expectations as Solana seeks lower support levels. The next few days will be crucial as the market evaluates SOL’s strength at $160 and prepares for potential moves to new highs.

Featured image from Dall-E, chart from TradingView

Bitcoin Price Correction Triggers $296 Million In Liquidations – Can BTC Still Hit ATH?

Este artículo también está disponible en español.

Bitcoin (BTC) has had a volatile 24 hours, hitting as low as $68,830 on the Binance crypto exchange before recovering some losses.

Liquidation Data At A Glance

Although BTC is trading close to its all-time high (ATH) value of $73,737, yesterday’s quick drop in price cast doubts on whether the top digital asset will be able to record a new ATH.

Related Reading

According to CoinGlass data from the crypto liquidations tracker, more than $296 million of active positions were liquidated in the last 24 hours. 

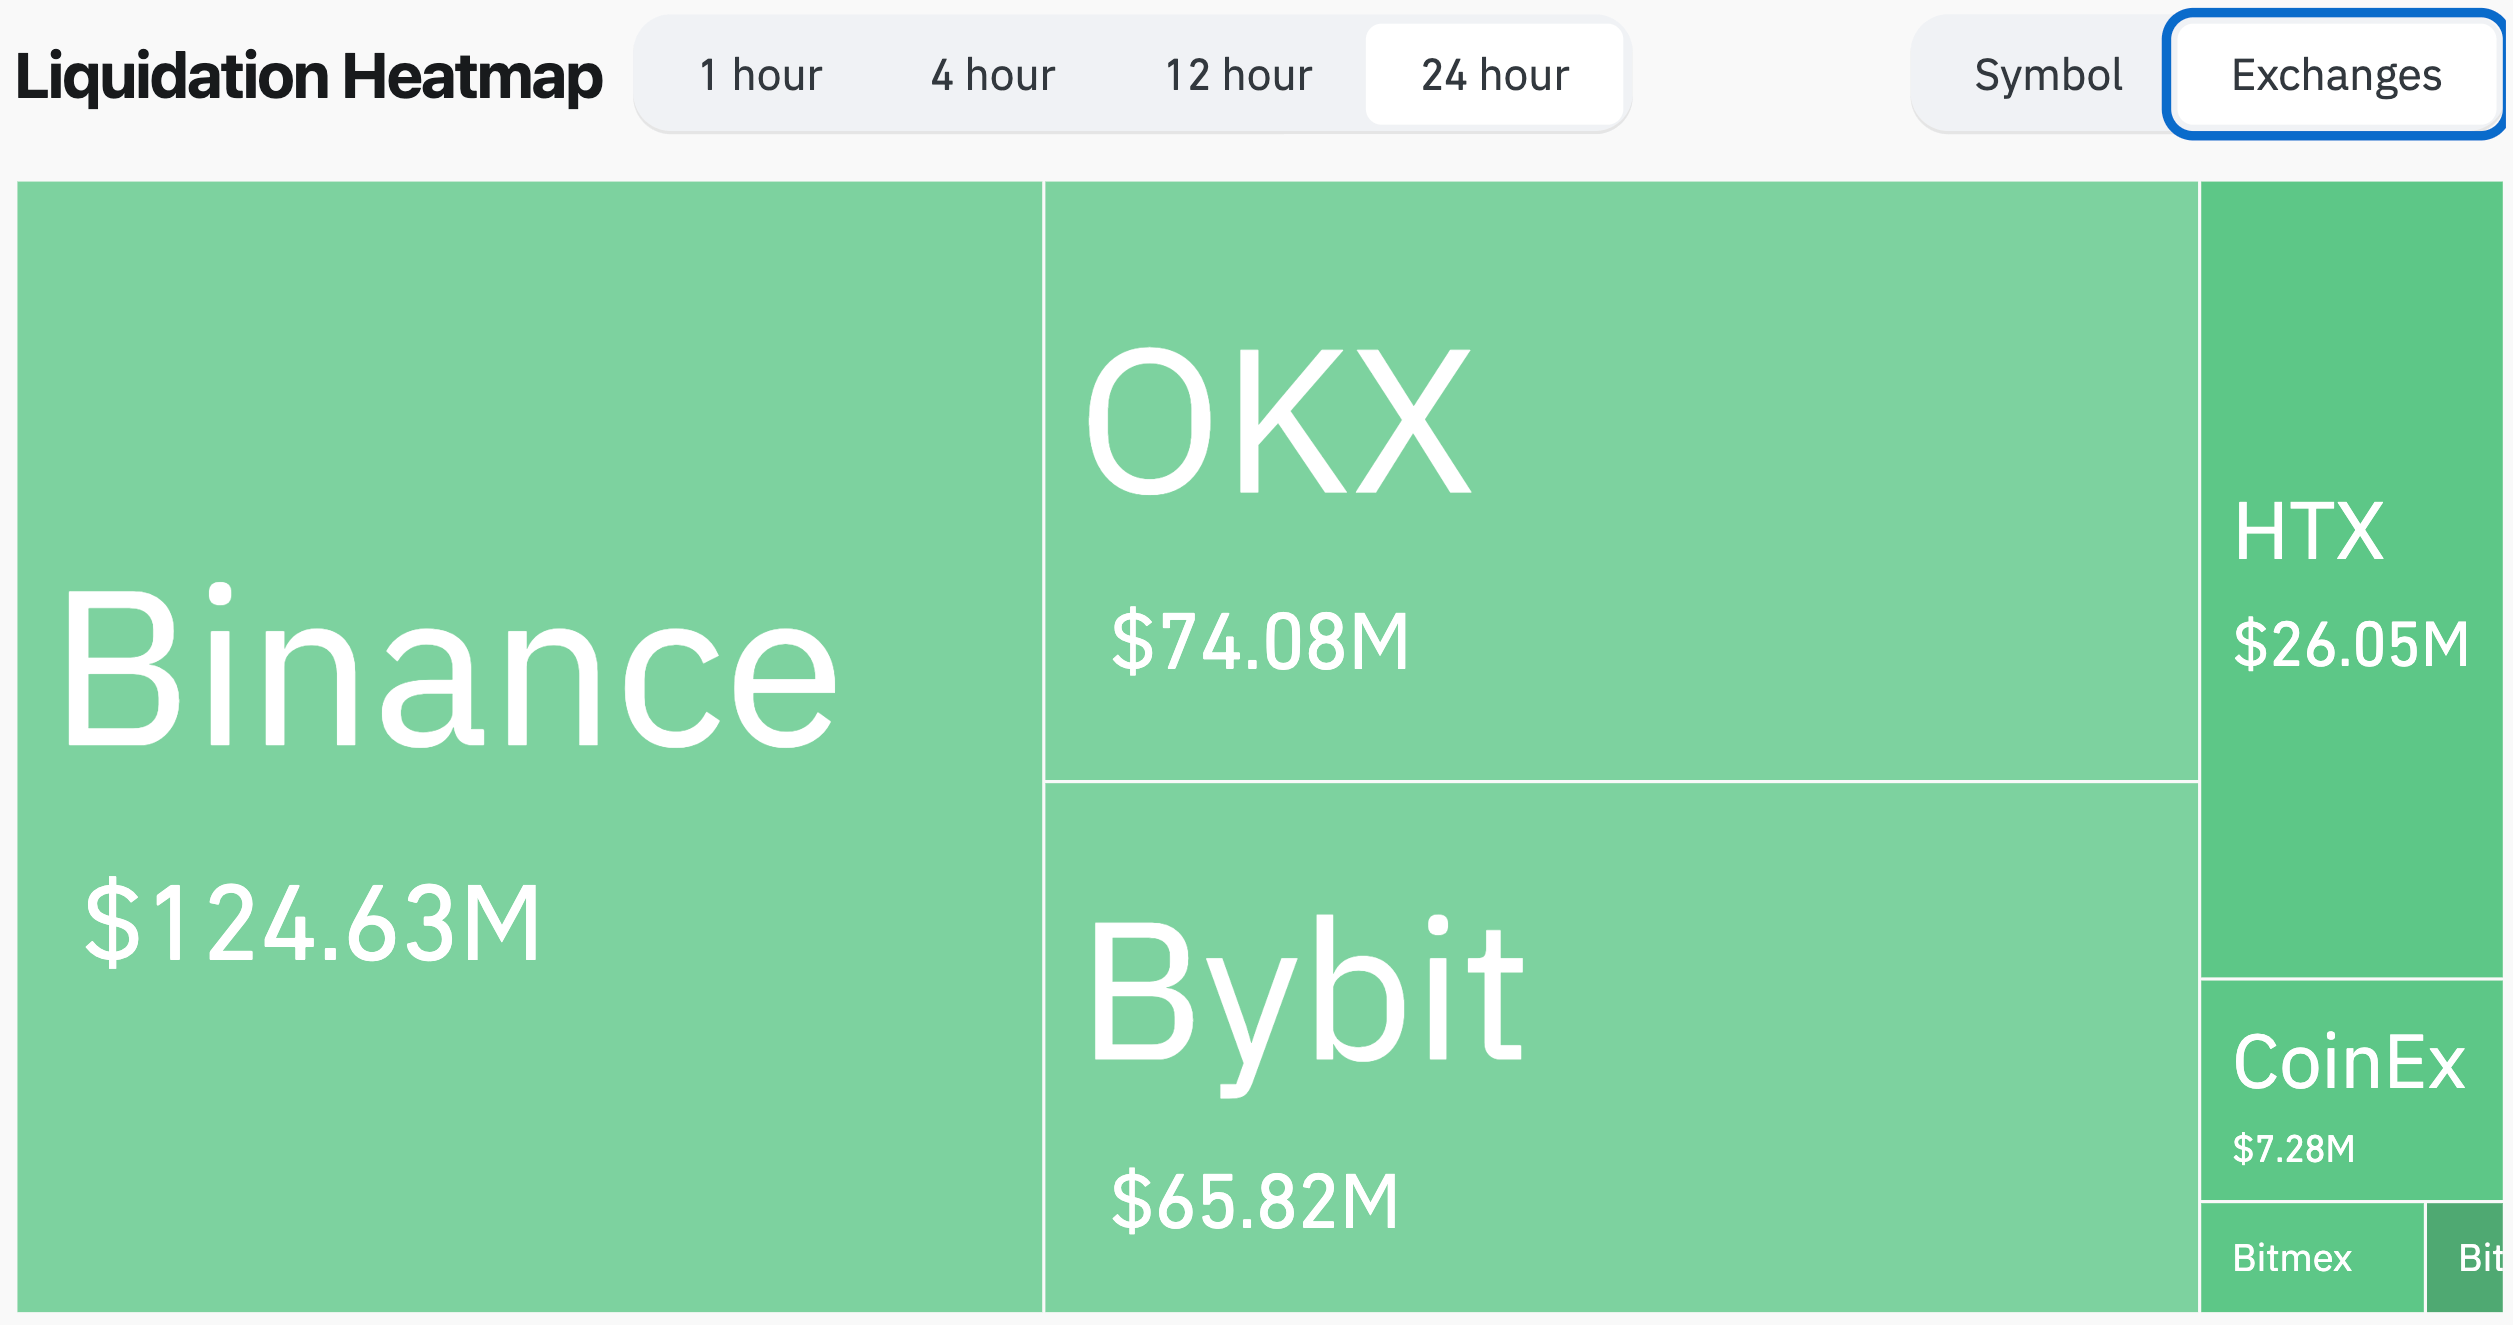
Nearly 77% were long positions, indicating that traders were largely betting on BTC’s continued upward momentum. Binance saw the most liquidations at $124 million, followed by OKX with $74 million and Bybit with $65 million.

crypto exchanges
Source: CoinGlass

In digital assets, Bitcoin led with over $97 million worth of positions liquidated, followed by Ethereum (ETH) at $47 million, and Solana at nearly $17 million.

With yesterday’s slump, the total crypto market cap has shrunk by about 3.5%, currently valued at $2.48 trillion. It is worth noting that although BTC is close to its ATH, the total crypto market cap is still considerably far from its ATH of $2.98 trillion recorded in November 2021.

The gap between BTC’s performance and the overall market cap suggests that altcoins have not kept pace with BTC’s recent gains, contributing to the disparity. This could also indicate a cautious investor sentiment, favoring BTC over altcoins during uncertain periods.

At the same time, it suggests that there is still a lot of room for altcoins to grow, which could tempt some more risk-seeking investors to accumulate altcoins in hopes of extraordinary gains relative to BTC.

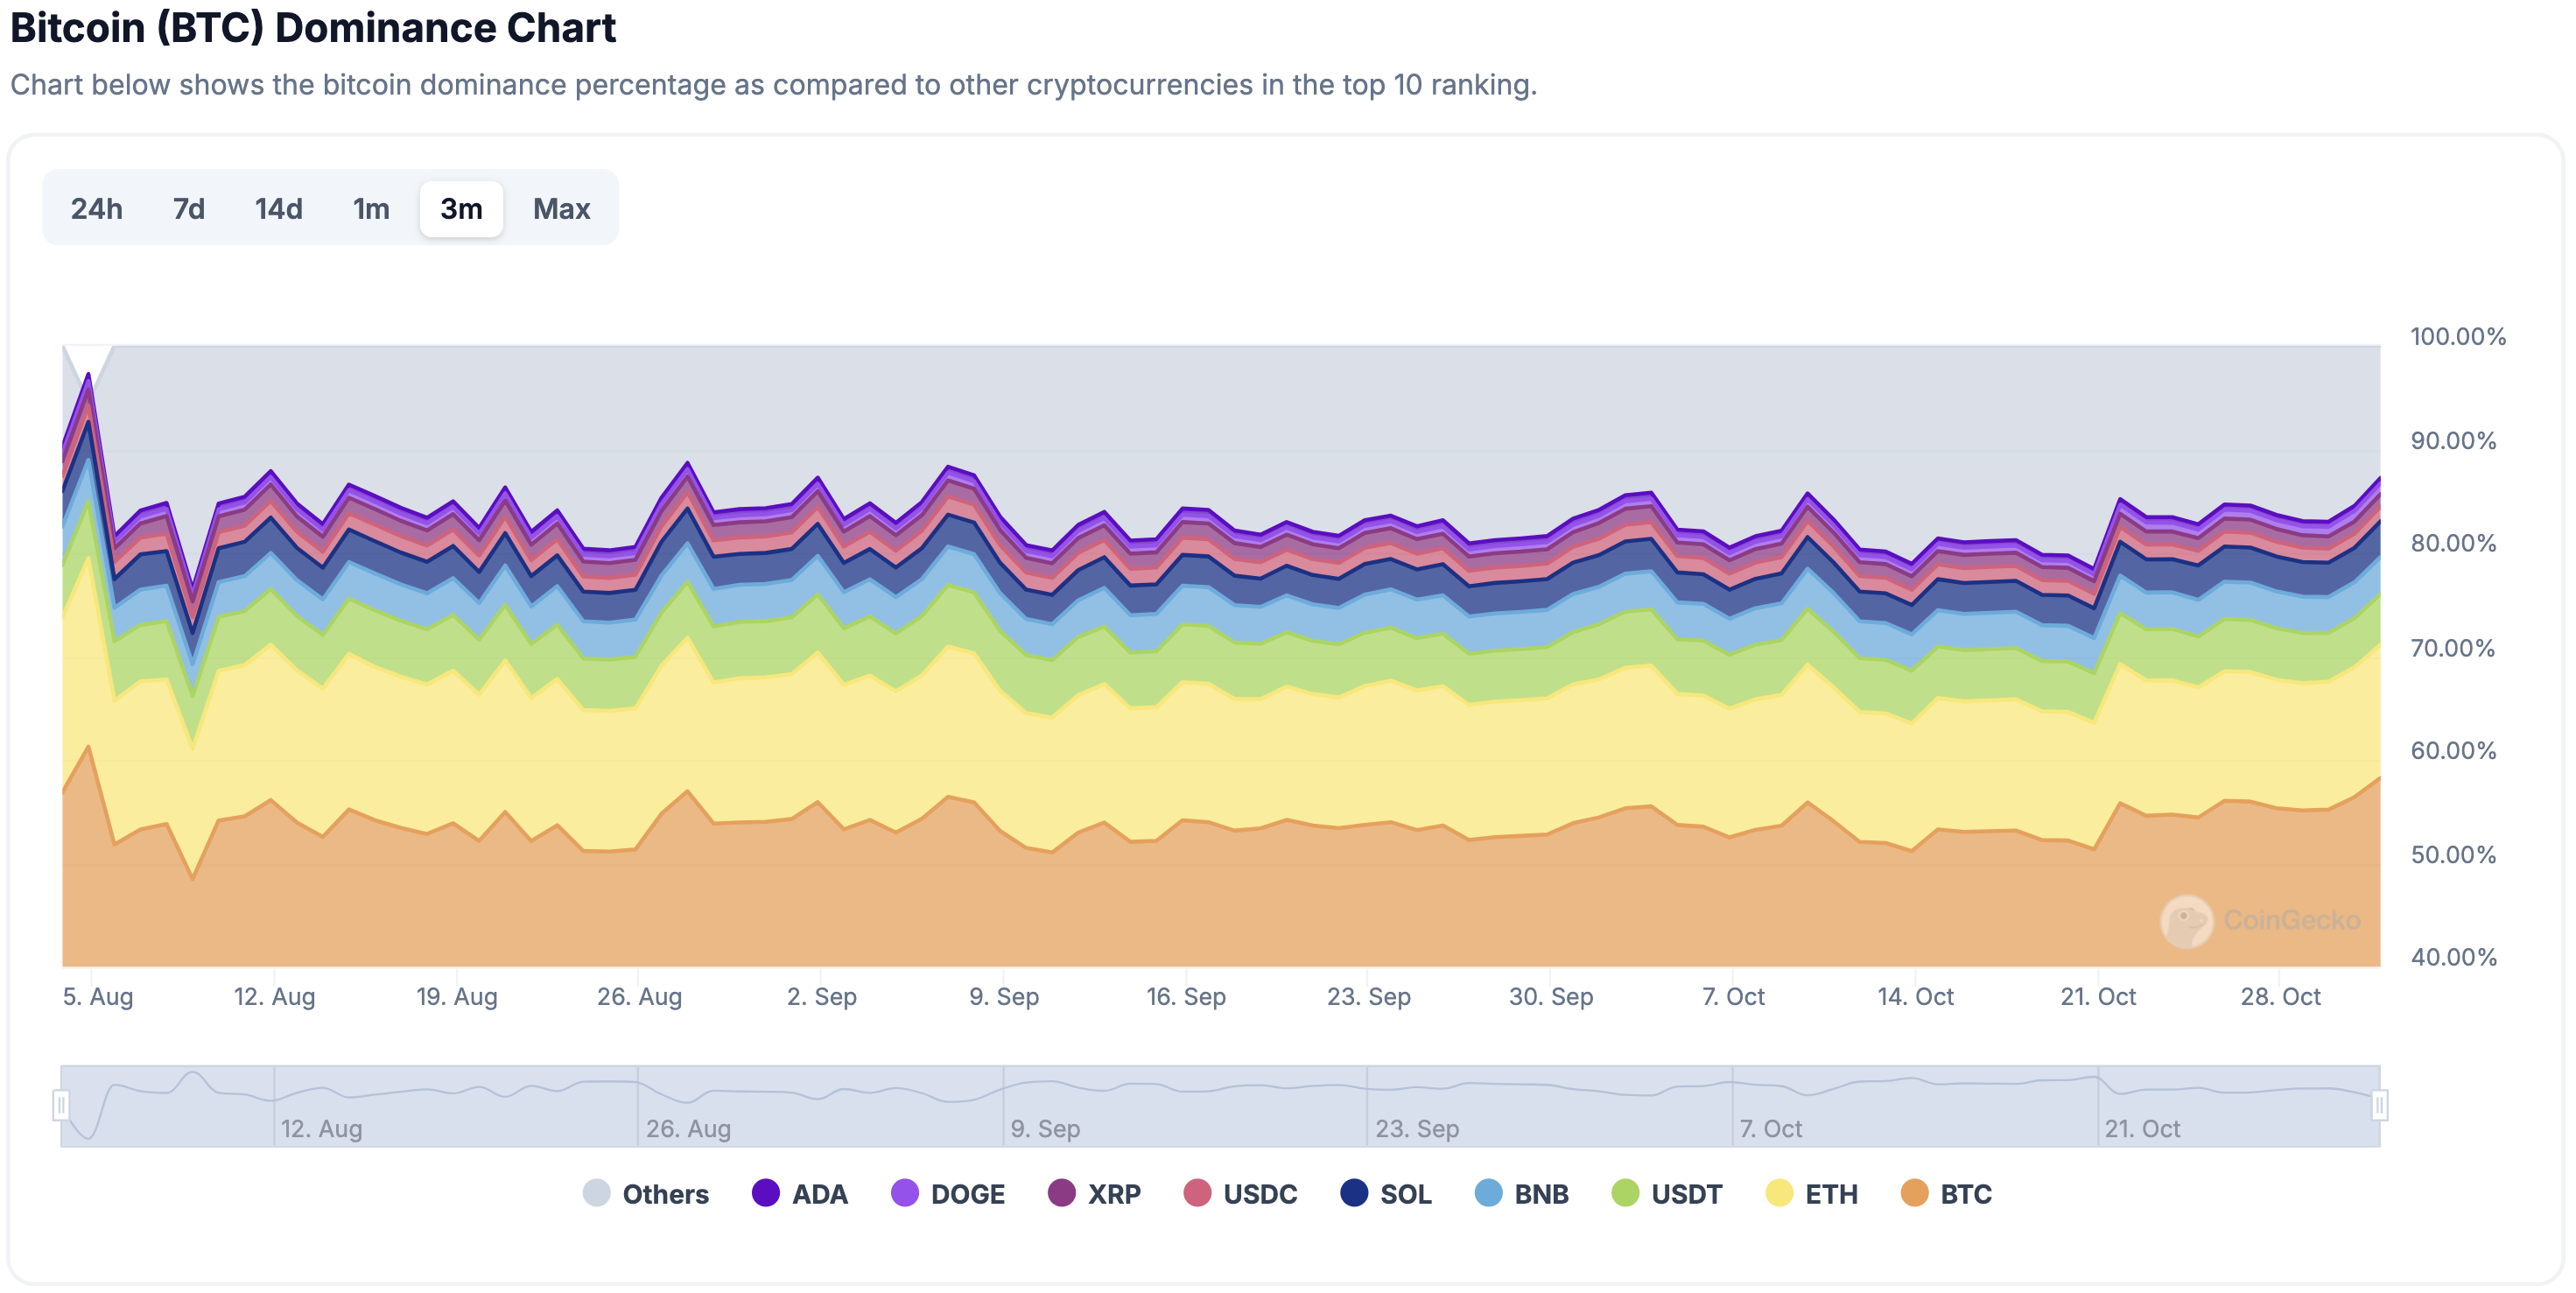
That said, Bitcoin dominance – a metric that gauges the proportion of the overall crypto market cap commanded by BTC – is steadily climbing toward 60%. A higher BTC dominance could spell disaster for altcoins already trailing BTC in price action.

btc dominance
Source: CoinGecko

Can Bitcoin Still Hit ATH?

The question on the minds of crypto enthusiasts is whether BTC will achieve a new ATH during this rally. The answer is not straightforward.

Related Reading

Factors supporting a potential new ATH include the increased likelihood of pro-crypto US presidential candidate Donald Trump winning the election, the effects of BTC halving, increased inflows to BTC exchange-traded funds (ETF), and a low interest rate environment.

On the contrary, sentiment indicators like the Fear and Greed Index suggest the market is still in a ‘greed’ phase, hinting that there could be more pain for the market before the next leg up.

Regardless of the outcome, the crypto market will likely remain volatile in the coming days. However, long-term BTC holders do not appear fazed by this prospect, as profit-taking remained relatively muted when the digital asset crossed $71,000.

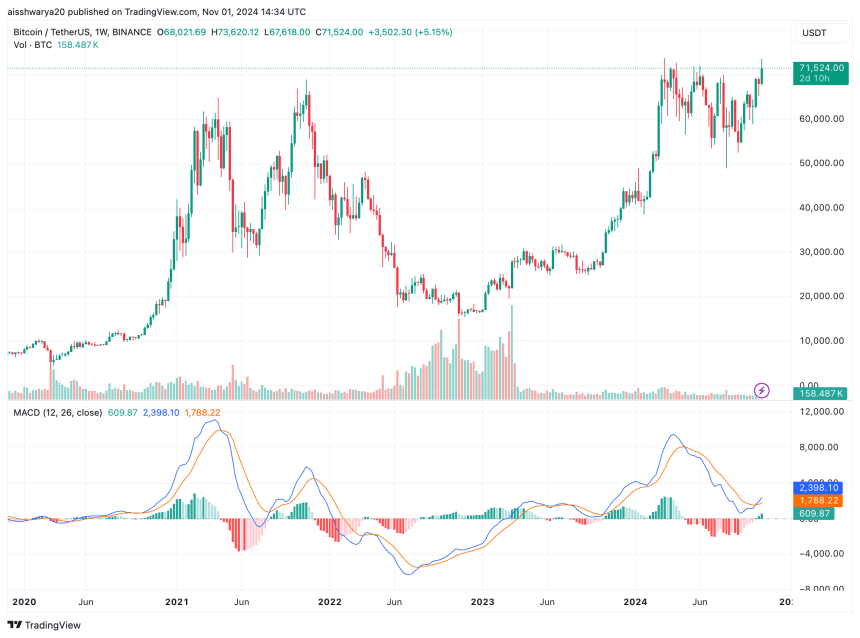
At press time, BTC trades at $71,524, up a modest 0.6% in the past 24 hours, with a reported market cap of $1.41 trillion.

bitcoin
BTC trades at $71,524 on the daily chart | Source: BTCUSDT on TradingView.com

Featured image from Unsplash, Charts from CoinGecko, CoinGlass, and Tradingview.com

Ethereum Claims Address Dominance With 43% Lead—Will It Keep Rising?

Este artículo también está disponible en español.

Ethereum missed out on this week’s crazy price movements. For the last couple of days, Bitcoin has dominated the bigger crypto market, making gigantic strides almost crossing the $73,500 mark for its best in recent months. Other altcoins have also followed that trajectory as SOL and DOGE trail Bitcoin.

Related Reading

As Bitcoin retests a new high this October, Ethereum lags, even touching a low of $2,322 last October 3rd. Since then, Ether has slowly inched its way up the price charts, reaching as high as $2,721, before re-tracing the $2,500 level.

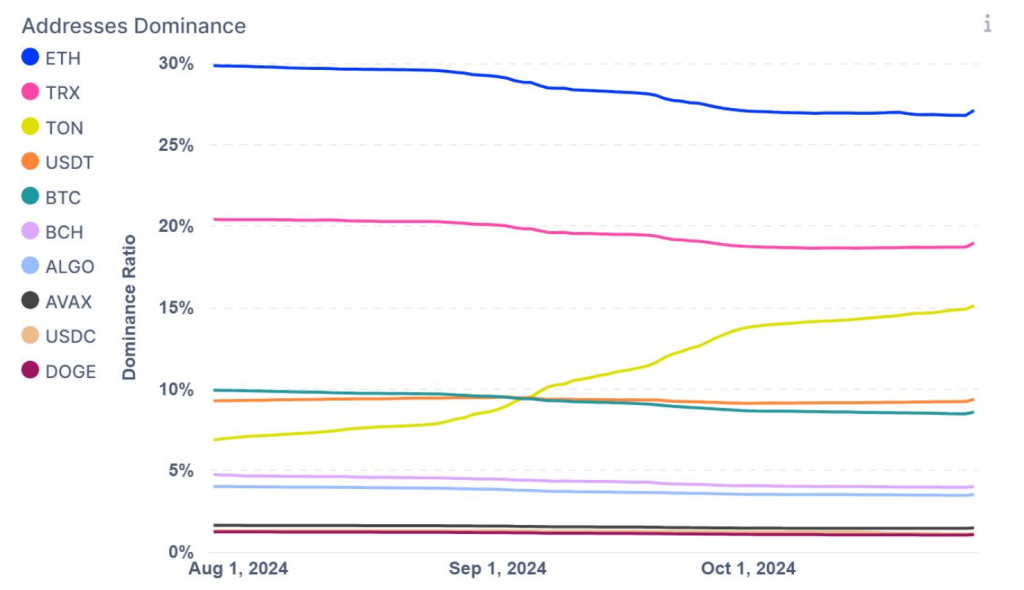
Analysts say Ether’s recent move is due to increased on-chain activities. Based on IntoTheBlock data, Ethereum’s blockchain has seen an increase in addresses, beating other ecosystems. The blockchain accounts for 43% of all active addresses, leading other popular blockchain projects like BTC, TRX, TON, and USDT.

Ethereum Addresses Dominate

The active addresses in a blockchain are an important metric that analysts check to gauge the blockchain’s popularity. According to InTheBlock tracking, the Ethereum blockchain remains the leader, accounting for 43% of all active addresses.

ETH is currently trading at $2,510. Chart: TradingView

Tron comes in second, with a 27% share of all active addresses. TON by Telegram is also in the Top 5 list of InTheBlock as of October 1st, and it offers an interesting picture of an increasing user base.

Other tokens making significant inroads in active addresses are USDT by Tether and Toncoin. Analysts say this data indicates Ethereum’s dominance, particularly in adoption and network activity.

Related Reading

Can We Expect An ETH Price Rally Soon?

Recent data from active addresses reveal that currently, Ethereum is the most active blockchain. The strength of demand and interest for DeFi projects, dApps, and even NFTs can be ascribed to activity in its ecosystem.

As some blockchain analysts note, improving network activity and adoption often increases prices. ETH can surprise with increased active addresses and prevailing market conditions. Other on-chain data support the blockchain. For example, its Exchange Supply Ratio is down to 0.141 from 0.145, increasing accumulation.

What To Expect From Ethereum In The Next Few Days

Currently, ETH trades at $2,516, which has a weekly gain of 3.74%. There are also an increasing number of active addresses and strong uptrend. Analysts predict ETH to retest the mark of $2,800 in the coming weeks or months.

Featured image from Bankrate, chart from TradingView


Solana (SOL) Slides to Support: Bulls Ready to Defend?

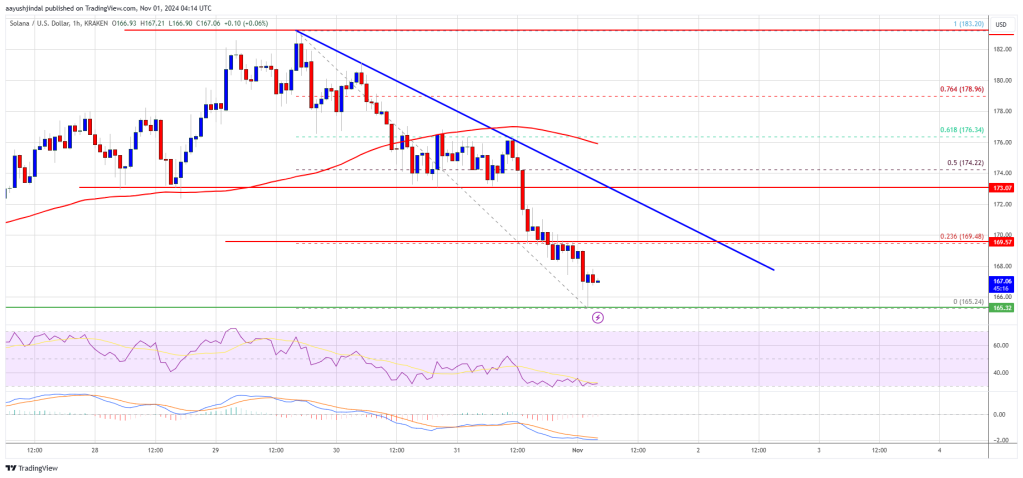
Solana trimmed gains and traded below the $175 support zone. SOL price is now approaching the $165 support and might bounce back in the near term.

  • SOL price started a fresh decline after it struggled near the $185 zone against the US Dollar.
  • The price is now trading below $172 and the 100-hourly simple moving average.
  • There is a key bearish trend line forming with resistance at $172 on the hourly chart of the SOL/USD pair (data source from Kraken).
  • The pair could start a decent upward movement if it stays above the $165 and $162 support levels.

Solana Price Holds Support

Solana price struggled to clear the $185 resistance and started a fresh decline like Bitcoin and Ethereum. There was a drop below the $180 and $175 support levels.

The bears even pushed the price below $172 and tested the $165 support zone. A low was formed at $165 and the price is now consolidating losses below the 23.6% Fib retracement level of the downward move from the $183 swing high to the $165 low.

Solana is now trading below $172 and the 100-hourly simple moving average. On the upside, the price is facing resistance near the $170 level. The next major resistance is near the $172 level. There is also a key bearish trend line forming with resistance at $172 on the hourly chart of the SOL/USD pair.

Solana Price

The main resistance could be $175 or the 50% Fib retracement level of the downward move from the $183 swing high to the $165 low. A successful close above the $175 resistance level could set the pace for another steady increase. The next key resistance is $182. Any more gains might send the price toward the $185 level.

More Losses in SOL?

If SOL fails to rise above the $170 resistance, it could continue to move down. Initial support on the downside is near the $165 level. The first major support is near the $162 level.

A break below the $162 level might send the price toward the $150 zone. If there is a close below the $150 support, the price could decline toward the $135 support in the near term.

Technical Indicators

Hourly MACD – The MACD for SOL/USD is gaining pace in the bearish zone.

Hourly Hours RSI (Relative Strength Index) – The RSI for SOL/USD is below the 50 level.

Major Support Levels – $165 and $162.

Major Resistance Levels – $170 and $172.

Ethereum Blobs Are ‘Insanely Bullish” For ETH Price: Research

Este artículo también está disponible en español.

Tim Robinson, Head of Crypto Research at BlueYard Capital, has unveiled groundbreaking simulations indicating that Ethereum’s implementation of “blobs” could be exceptionally bullish for the long-term price of ETH. In a series of posts on X, Robinson highlighted how blobs could revolutionize Ethereum’s scalability and economic dynamics.

“Many people arguing about blobs, but so far no one has simulated how they respond to demand… until now,” Robinson stated. “TL;DR: Blobs are insanely bullish for ETH long term.”

Why Blobs Are ‘Insanely Bullish’ For Ethereum Price

Blobs, introduced in Ethereum Improvement Proposal (EIP)-4844, are large data structures designed to enhance the network’s capacity by efficiently storing and processing data off-chain. This mechanism is pivotal for Layer 2 (L2) scaling solutions, enabling them to offer lower transaction fees while maintaining security through Ethereum’s consensus.

Related Reading

Robinson’s simulation projects Ethereum operating at 10,000 transactions per second (TPS), burning 6.5% of its total ETH supply annually, with L2 transactions costing an average of $0.06. This scenario involves 16 MB of blobs per block, aligning with Ethereum co-founder Vitalik Buterin’s medium-term goals outlined in his latest “The Surge” post.

“Yes, that’s Ethereum operating at 10k TPS, burning 6.5% a year while L2 transactions cost an average of $0.06, with 16 MB of blobs per block,” Robinson elaborated. “You thought L2’s were parasitic and Vitalik didn’t think this through? Ah, sweet summer child, little do you realize how insane this will get when the Ethereum ecosystem really kicks into high gear.”

A key insight from Robinson’s research is the rapid escalation of ETH burning as blob usage increases. “It’s interesting how quickly blobs go from being free to burning a ton of ETH. It seems almost everyone doesn’t understand this tipping point. It also makes me think there might be a better pricing mechanism,” he observed.

Robinson provides a simulation tool illustrating the ETH burn rate‘s exponential growth as TPS scales from the current ~180 TPS to 400 TPS. The data shows burned ETH increasing from roughly 4 ETH per day to 1,832 ETH per day.

The scalability potential is further enhanced by the implementation of Peer Data Availability Sampling (PeerDAS), which allows blob capacity to scale with the number of validators. “Because total blob capacity scales with total validators, after PeerDAS is implemented, blobs can scale as high as needed,” Robinson explained. “There are 10k+ nodes to shard the load between them. While other ecosystems struggle under load, Ethereum will supply the world with cheap, abundant block-space while being extremely deflationary.”

Related Reading

An intriguing feedback loop identified by Robinson is the inverse relationship between ETH price and the burn rate. “Another interesting feedback loop is the lower the ETH price, the higher the burn! As transaction prices are lower, more transactions are made, and the burn soars,” he noted. “See how different the burn is with ETH at $2k vs ETH at $10k”.

Addressing the question of value accrual for ETH, Robinson stated, “So how will ETH accrue value? Being the most useful, scarce, deflationary asset with 10,000+ teams using Ethereum to grow their products will probably do it. Long term, ETH has the best fundamentals in the world; it just takes time for them to play out.”

The research sparked enthusiasm and discussions within the ETH community. Mat (@materkel) commented on X: “Will be extremely interesting once we hit blob capacity. My guess is a lot of L2s still need to figure out how to handle this case and properly fee their users. There will be a lot of inefficiencies to fix; we just didn’t really have multiple competing L2s in this scenario before. Once the dust settles, we’ll have proper price discovery both for fees on L2s together with blobs on L1.”

Robinson responded, emphasizing the importance of proactive analysis: “Yeah, absolutely! I’m trying to bring the data so we can solve any problems before we get there. The market becomes more stable with more blobs, but in the early days, fees could be quite volatile.”

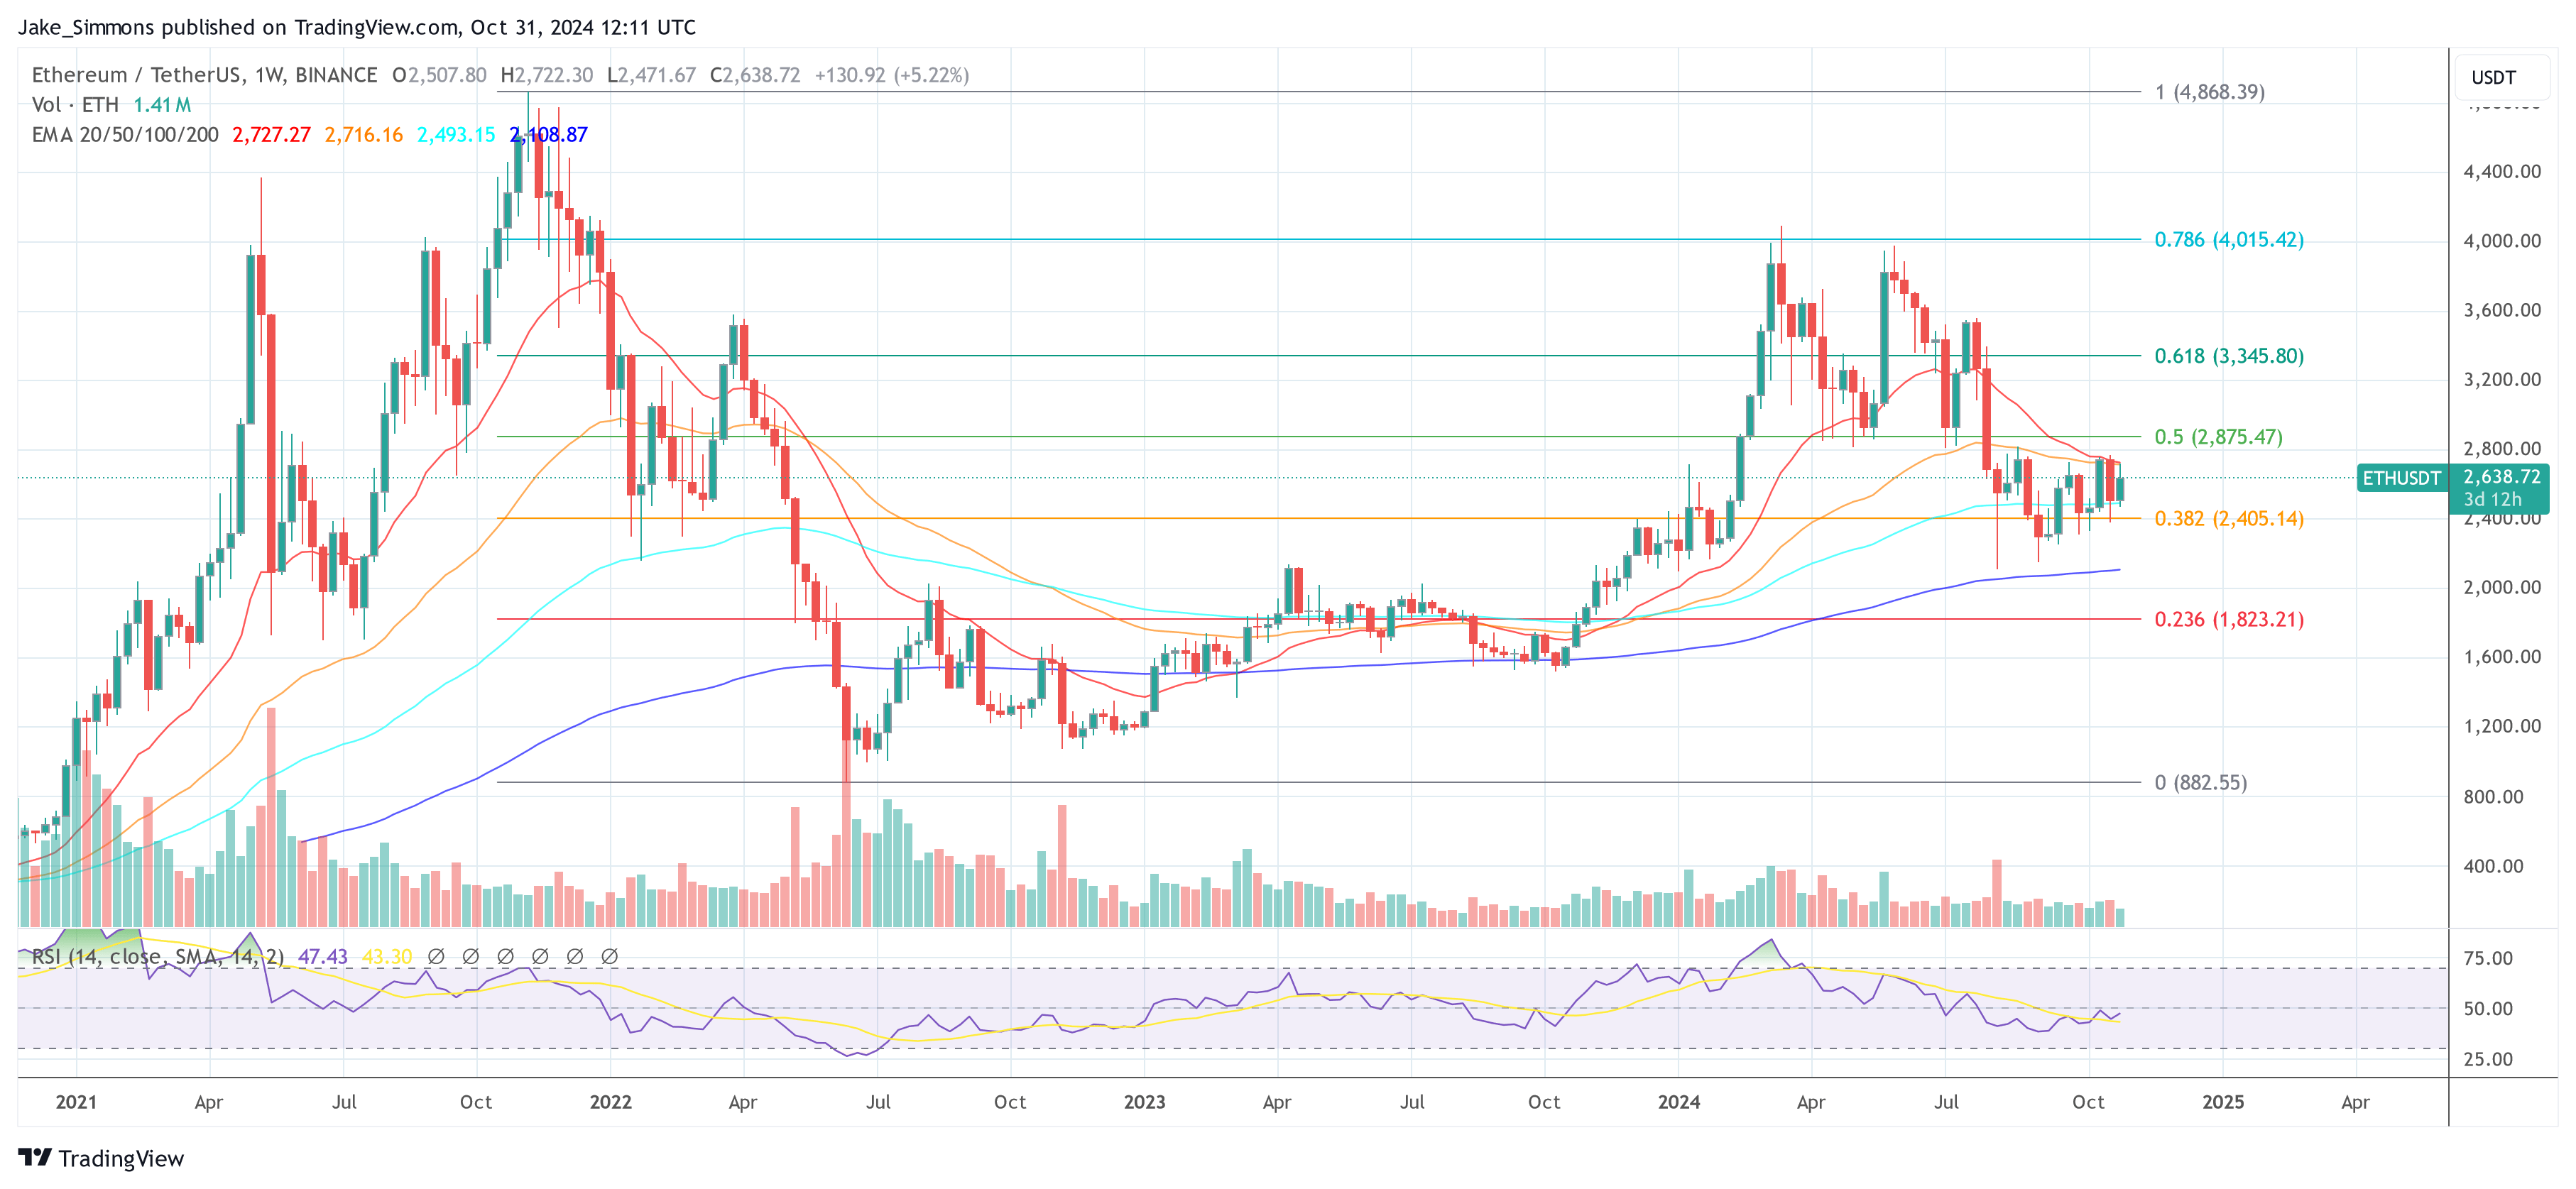
At press time, ETH traded at $2,638.

Ethereum price
Ethereum price needs to break the 0.5 Fib, 1-week chart | Source: ETHUSDT on TradingView.com

Featured image created with DALL.E, chart from TradingView.com


BNB Price Slips as Peers Climb: Can It Regain Ground?

Aayush Jindal, a luminary in the world of financial markets, whose expertise spans over 15 illustrious years in the realms of Forex and cryptocurrency trading. Renowned for his unparalleled proficiency in providing technical analysis, Aayush is a trusted advisor and senior market expert to investors worldwide, guiding them through the intricate landscapes of modern finance with his keen insights and astute chart analysis.

From a young age, Aayush exhibited a natural aptitude for deciphering complex systems and unraveling patterns. Fueled by an insatiable curiosity for understanding market dynamics, he embarked on a journey that would lead him to become one of the foremost authorities in the fields of Forex and crypto trading. With a meticulous eye for detail and an unwavering commitment to excellence, Aayush honed his craft over the years, mastering the art of technical analysis and chart interpretation.
As a software engineer, Aayush harnesses the power of technology to optimize trading strategies and develop innovative solutions for navigating the volatile waters of financial markets. His background in software engineering has equipped him with a unique skill set, enabling him to leverage cutting-edge tools and algorithms to gain a competitive edge in an ever-evolving landscape.

In addition to his roles in finance and technology, Aayush serves as the director of a prestigious IT company, where he spearheads initiatives aimed at driving digital innovation and transformation. Under his visionary leadership, the company has flourished, cementing its position as a leader in the tech industry and paving the way for groundbreaking advancements in software development and IT solutions.

Despite his demanding professional commitments, Aayush is a firm believer in the importance of work-life balance. An avid traveler and adventurer, he finds solace in exploring new destinations, immersing himself in different cultures, and forging lasting memories along the way. Whether he’s trekking through the Himalayas, diving in the azure waters of the Maldives, or experiencing the vibrant energy of bustling metropolises, Aayush embraces every opportunity to broaden his horizons and create unforgettable experiences.

Aayush’s journey to success is marked by a relentless pursuit of excellence and a steadfast commitment to continuous learning and growth. His academic achievements are a testament to his dedication and passion for excellence, having completed his software engineering with honors and excelling in every department.

At his core, Aayush is driven by a profound passion for analyzing markets and uncovering profitable opportunities amidst volatility. Whether he’s poring over price charts, identifying key support and resistance levels, or providing insightful analysis to his clients and followers, Aayush’s unwavering dedication to his craft sets him apart as a true industry leader and a beacon of inspiration to aspiring traders around the globe.

In a world where uncertainty reigns supreme, Aayush Jindal stands as a guiding light, illuminating the path to financial success with his unparalleled expertise, unwavering integrity, and boundless enthusiasm for the markets.

OTC Exec Cites Supply Shock

Este artículo también está disponible en español.

In an analysis shared on X, Taran Sabharwal, CEO of Stix—a leading OTC trading platform specializing in liquidity solutions for private crypto transactions—provided insights into the upcoming unlock dynamics of the Celestia (TIA) token scheduled for October 31, 2024. His assessment suggests that the market may be underestimating the potential impact on TIA’s price action heading into November.

Why Celestia (TIA) Could Be A Buy

“TIA – an OTC story,” Sabharwal began. “We used on-chain data (via @celenium_io API) to judge exactly how the unlock dynamics may shape TIA’s PA going into Nov. The results are in the table above. We’ve summarized that a total of 92.3M TIA will be liquid post unlock, which would act as the upper bound of overall spot selling pressure.”

Interestingly, this figure accounts for less than 50% of the total cliff unlocks, suggesting that the actual sell pressure may be only half of what the market has been anticipating. Sabharwal highlighted that the real increase in circulating supply compared to the current supply indicates a 41.8% dilution.

Related Reading

A significant factor in this dynamic is the activity of OTC buyers who acquired large amounts of the initial unlock and hedged on perpetual futures, causing open interest to surge in recent months. “We expect many of these shorts to continue winding down, partially negating the spot-selling pressure,” he explained. This unwinding could serve as a bullish signal for spot buyers due to the potential reset in funding rates.

Sabharwal’s analysis included several key assumptions. OTC round buyers possess an 11 million TIA cliff unlock, included in the non-staked token category since these tokens originated from treasury wallets not tagged on the blockchain explorer. His team mapped a total of 292 vesting wallets but acknowledged some gaps, which were also included in the non-staked category.

Reflecting on TIA’s OTC history on Stix, Sabharwal observed that Celestia has been one of the most actively traded assets in the OTC market this cycle. Early in the cycle, it offered an attractive opportunity for directional buyers, while sellers were eager to realize large unrealized profits without expecting an imminent bull market in Q3 2023.

He continued: “In Q1 2024, the bull had matured and TIA rallied to $20+. OTC activity was minimal here as sellers didn’t want to take larger discounts (40+%) and buyers didn’t want to bid higher than the $8.5 ceiling. We saw almost no activity as sellers were ‘feeling’ rich and wanted to stay risk-on, despite having the opportunity to realize 100-800x on their investments.”

Related Reading

The dynamics shifted when TIA fell below $5. This was around the time when the Celestia Foundation started raising its OTC round of $100M at $3. “The vesting for buyers was the same as those of private investors—33% unlock on Oct 31 2024 (<2 months from the round) and a 12-month linear unlock,” Sabharwal noted.

During the third and fourth quarters of 2024, aggressive OTC trading activity resumed, with sellers offloading various positions. Stix alone facilitated approximately $60 million in TIA volume since July, suggesting that total trading volume could exceed $80 million across all liquidity channels, assuming Stix holds a 75% market share in the OTC space.

Summing up his analysis, Sabharwal concluded: “TLDR: Shorts will keep unwinding into the unlock and funding rates may reset to 0 or positive. People who missed the 9th October unstaking deadline may also have unstaked during October, causing further spot supply (ready to be sold) going into November. Either way, the supply shock is massive and it’s been the most broadcasted unlock of this cycle. That, coupled with suppressing OTC discounts, may create a lot of action for the coin.”

Renowned crypto analyst Will Clemente also weighed in on the developments via X: “Great piece on $TIA OTC activity by Taran from Stix. TLDR: OTC discount to spot in the private market has compressed over the last year, showing growing demand into the unlock. Stix alone has done $60mm in TIA OTC volume since July.”

Clemente added his perspective on the potential market impact: “I think this BTC price action has further slid the probability of Thursday’s TIA unlock being bearish towards ‘no’. 6 months of reaccumulation after 80% drawdown, ton of OTC volume, most widely telegraphed unlock in crypto history, 9 figs short, BTC nearing ATHs. Am long rn.”

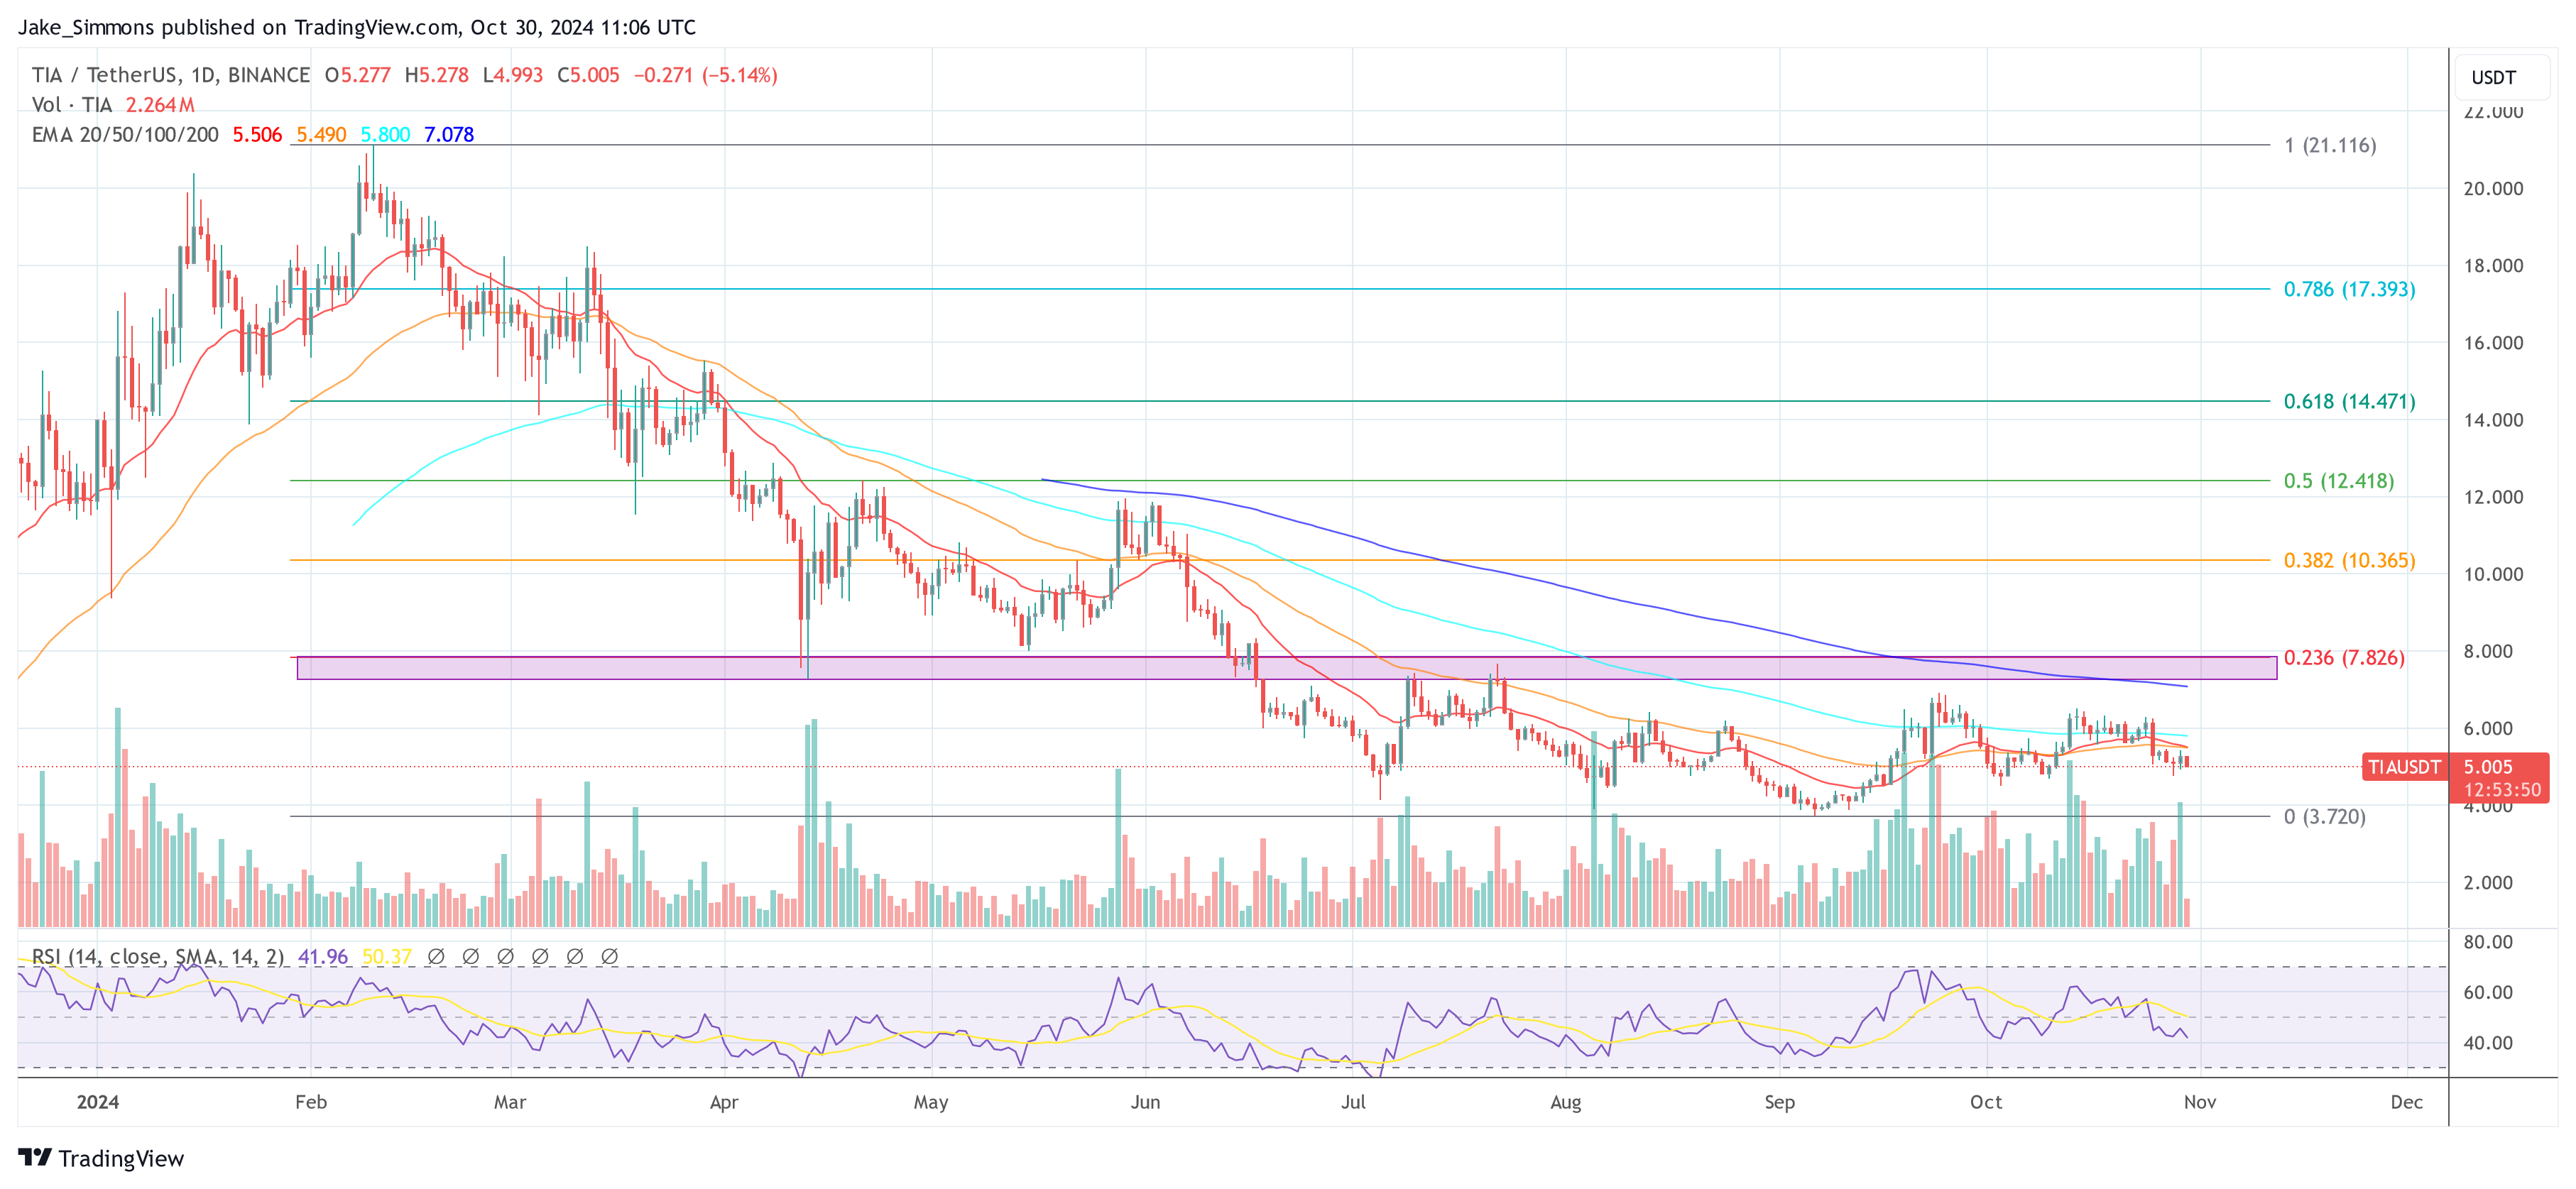
At press time, TIA traded at $5.00.

Celestia TIA price
TIA price needs to break the red resistance area, 1-day chart | Source: TIAUSDT on TradingView.com

Featured image created with DALL.E, chart from TradingView.com

POPCAT Reaches New Record Price Of $1.75

Ronaldo is an experienced crypto enthusiast dedicated to the nascent and ever-evolving industry. With over five years of extensive research and unwavering dedication, he has cultivated a profound interest in the world of cryptocurrencies.

Ronaldo’s journey began with a spark of curiosity, which soon transformed into a deep passion for understanding the intricacies of this groundbreaking technology.

Driven by an insatiable thirst for knowledge, Ronaldo has delved into the depths of the crypto space, exploring its various facets, from blockchain fundamentals to market trends and investment strategies. His tireless exploration and commitment to staying up-to-date with the latest developments have granted him a unique perspective on the industry.

One of Ronaldo’s defining areas of expertise lies in technical analysis. He firmly believes that studying charts and deciphering price movements provides valuable insights into the market. Ronaldo recognizes that patterns exist within the chaos of crypto charts, and by utilizing technical analysis tools and indicators, he can unlock hidden opportunities and make informed investment decisions. His dedication to mastering this analytical approach has allowed him to navigate the volatile crypto market with confidence and precision.

Ronaldo’s commitment to his craft goes beyond personal gain. He is passionate about sharing his knowledge and insights with others, empowering them to make well-informed decisions in the crypto space. Ronaldo’s writing is a testament to his dedication, providing readers with meaningful analysis and up-to-date news. He strives to offer a comprehensive understanding of the crypto industry, helping readers navigate its complexities and seize opportunities.

Outside of the crypto realm, Ronaldo enjoys indulging in other passions. As an avid sports fan, he finds joy in watching exhilarating sporting events, witnessing the triumphs and challenges of athletes pushing their limits. Furthermore, His passion for languages extends beyond mere communication; he aspires to master German, French, Italian, and Portuguese, in addition to his native Spanish. Recognizing the value of linguistic proficiency, Ronaldo aims to enhance his work prospects, personal relationships, and overall growth.

However, Ronaldo’s aspirations extend far beyond language acquisition. He believes that the future of the crypto industry holds immense potential as a groundbreaking force in history. With unwavering conviction, he envisions a world where cryptocurrencies unlock financial freedom for all and become catalysts for societal development and growth. Ronaldo is determined to prepare himself for this transformative era, ensuring he is well-equipped to navigate the crypto landscape.

Ronaldo also recognizes the importance of maintaining a healthy body and mind, regularly hitting the gym to stay physically fit. He immerses himself in books and podcasts that inspire him to become the best version of himself, constantly seeking new ways to expand his horizons and knowledge.

With a genuine desire to become the best version of himself, Ronaldo is committed to continuous improvement. He sets personal goals, embraces challenges, and seeks opportunities for growth and self-reflection. Ultimately, combining his passion for cryptocurrencies, dedication to learning, and commitment to personal development, Ronaldo aims to go hand-in-hand with the exciting new era that the emerging crypto technology is bringing to the world and societies.

Spot Bitcoin ETF Trading Exceeds $3 Billion As BTC Eyes Record Peak

Este artículo también está disponible en español.

As Bitcoin (BTC), the largest cryptocurrency by market capitalization, inches closer to its all-time high of $73,700 reached in March, the US spot Bitcoin ETF market has re-emerged as a key driver of the cryptocurrency’s recent price surge.

On Tuesday, total trading volume for spot Bitcoin ETFs surpassed $3 billion, coinciding with Bitcoin’s price briefly above the pivotal $73,000 mark for the first time in over 7 months. 

Bitcoin ETF Market Set To Surpass 1 Million BTC Holdings Soon

Notably, crypto investor BigRig observed a remarkable uptick in Bitcoin ETF purchases over the past two weeks, reporting $2.673 billion in inflows since October 16. 

This accounts for a substantial 11.8% of total ETF inflows during this period, suggesting a robust interest from institutional and retail investors. BigRig also pointed out that, prior to Tuesday’s trading volume, this period represented the best day for ETF inflows.

Related Reading

Bloomberg ETF analyst Eric Balchunas added to the optimistic narrative by stating that US spot ETFs are on track to hold 1 million Bitcoin by next Wednesday, surpassing the holdings of Satoshi Nakamoto, the enigmatic creator of Bitcoin, by mid-December with an average addition of about 17,000 BTC per week.

However, Balchunas also cautioned that market volatility could impact these projections. “Anything can happen,” he noted, referencing the possibility of a sudden selloff that could delay the timeline. 

Conversely, if prices continue to rise and political factors, such as a potential Trump victory in the upcoming election, contribute to increased market enthusiasm, the expert believes that this influx of new investors could accelerate the pace of Bitcoin’s ascent to new highs.

Whale Accumulation Spurs Optimism

Despite heightened activity in the Bitcoin ETF market, the price of the largest cryptocurrency recently fell short of its all-time high, retracing to approximately $72,250 at the time of writing. 

However, there are positive indicators for Bitcoin bulls. The cryptocurrency has been consolidating above key support levels, with strong backing around the $66,000 mark. 

This support has effectively prevented any significant decline over the past week and has contributed to the ongoing rally. However, what would be a notable bullish indicator would be a sustained consolidation above the $70,000 level for the bulls, which could further demonstrate the strength of the current move.

Related Reading

Market expert Miles Deutscher has been vocal about his bullish outlook for Bitcoin, particularly in the latter months of the year. He recently pointed out a significant trend: whales—large holders of Bitcoin—are accumulating the cryptocurrency at an “unprecedented pace.” 

This observation suggests that institutional demand for Bitcoin is currently outpacing retail interest, a shift that could have implications for massive price movements to the upside in the near future.

Deutscher further highlighted that Bitcoin exchange reserves have reached all-time lows. This means that the amount of Bitcoin available on exchanges for trading has dwindled, signaling a supply squeeze.

Bitcoin ETF
The 1D chart shows BTC’s price trending upwards. Source: BTCUSDT on TradingView.com

Featured image from DALL-E, chart from TradingView.com 

VanEck Sees Bitcoin As Key Global Reserve Asset, Projecting $3 Million Price Tag By 2050

Este artículo también está disponible en español.

As Bitcoin rebounds from its brief correction and approaches the $70,000 mark, Matthew Sigel, head of digital asset research at asset manager and crypto ETF issuer VanEck, shared his insights on the cryptocurrency’s potential trajectory in light of the upcoming US presidential election and broader economic factors in a recent CNBC interview.

Bitcoin Recovery Tied To M2 Growth And Seller Exhaustion

Sigel noted the correlation between former President Donald Trump’s lead in betting polls against Vice President Kamala Harris and Bitcoin’s rise. He characterized Trump as the most pro-crypto candidate, suggesting that his policies may favor the cryptocurrency market. 

Conversely, Sigel expressed skepticism about Harris’s understanding of Bitcoin, indicating that her administration may not prioritize cryptocurrency issues.

Related Reading

Delving deeper into Bitcoin’s price dynamics, Sigel highlighted several critical correlations. He pointed out a negative correlation with the US dollar and a positive correlation with the global money supply growth, known as M2, leading to the current uptrend. 

Sigel also attributed the recent price recovery to the Federal Reserve’s pivot towards reacceleration of M2 growth, alongside what he described as a current “seller exhaustion” in the BTC market.  

Additionally, Sigel identified a promising bullish setup for Bitcoin as the election approaches, particularly its rising correlation with the Nasdaq, reaching a two-year high of 1.5. 

Sigel recalled a similar pattern from the 2020 elections, where Bitcoin exhibited low volatility until the election outcome was announced, leading to a substantial rally as new buyers flooded the market. “New buyers are born every day,” he emphasized, indicating a steady influx of interest in Bitcoin.

When discussing Bitcoin’s relationship with gold and M2, Sigel described Bitcoin as a “chameleon,” highlighting its dynamic correlations that can shift over time. This variability makes it challenging to accurately predict Bitcoin’s short- and long-term behaviors.

$180,000 Post-Election, $3 Million By 2050

In addition to US political dynamics, Sigel pointed to recent activities within the BRICS intergovernmental organization, particularly the involvement of new members Argentina, the UAE, and Ethiopia in Bitcoin mining. 

The researcher noted that these countries are leveraging government resources to mine Bitcoin to counter what he termed the “irresponsible” fiscal policies of the US. 

Sigel also mentioned Russia’s plans for its sovereign wealth fund to invest in Bitcoin mining through BRICS, proposing settling global trade in Bitcoin.

Related Reading

When asked about potential future price points for BTC, Sigel explained that historical rallies have seen increases of around 2,000%. If Bitcoin were to achieve half of that rise post-election, it could reach approximately $180,000. 

Looking further ahead, Sigel referenced a model from VanEck’s digital asset research team, predicting that by 2050, Bitcoin could serve as a reserve asset for global trade, held by central banks at a rate of 2%. This model suggests a staggering $3 million per Bitcoin price by that year.

Bitcoin
The 1D chart shows that BTC’s price is trending upward. Source: BTCUSDT on TradingView.com

At the time of writing, BTC is trading at $68,900, up 1.7% over the past 24 hours. 

Featured image from DALL-E, chart from TradingView.com